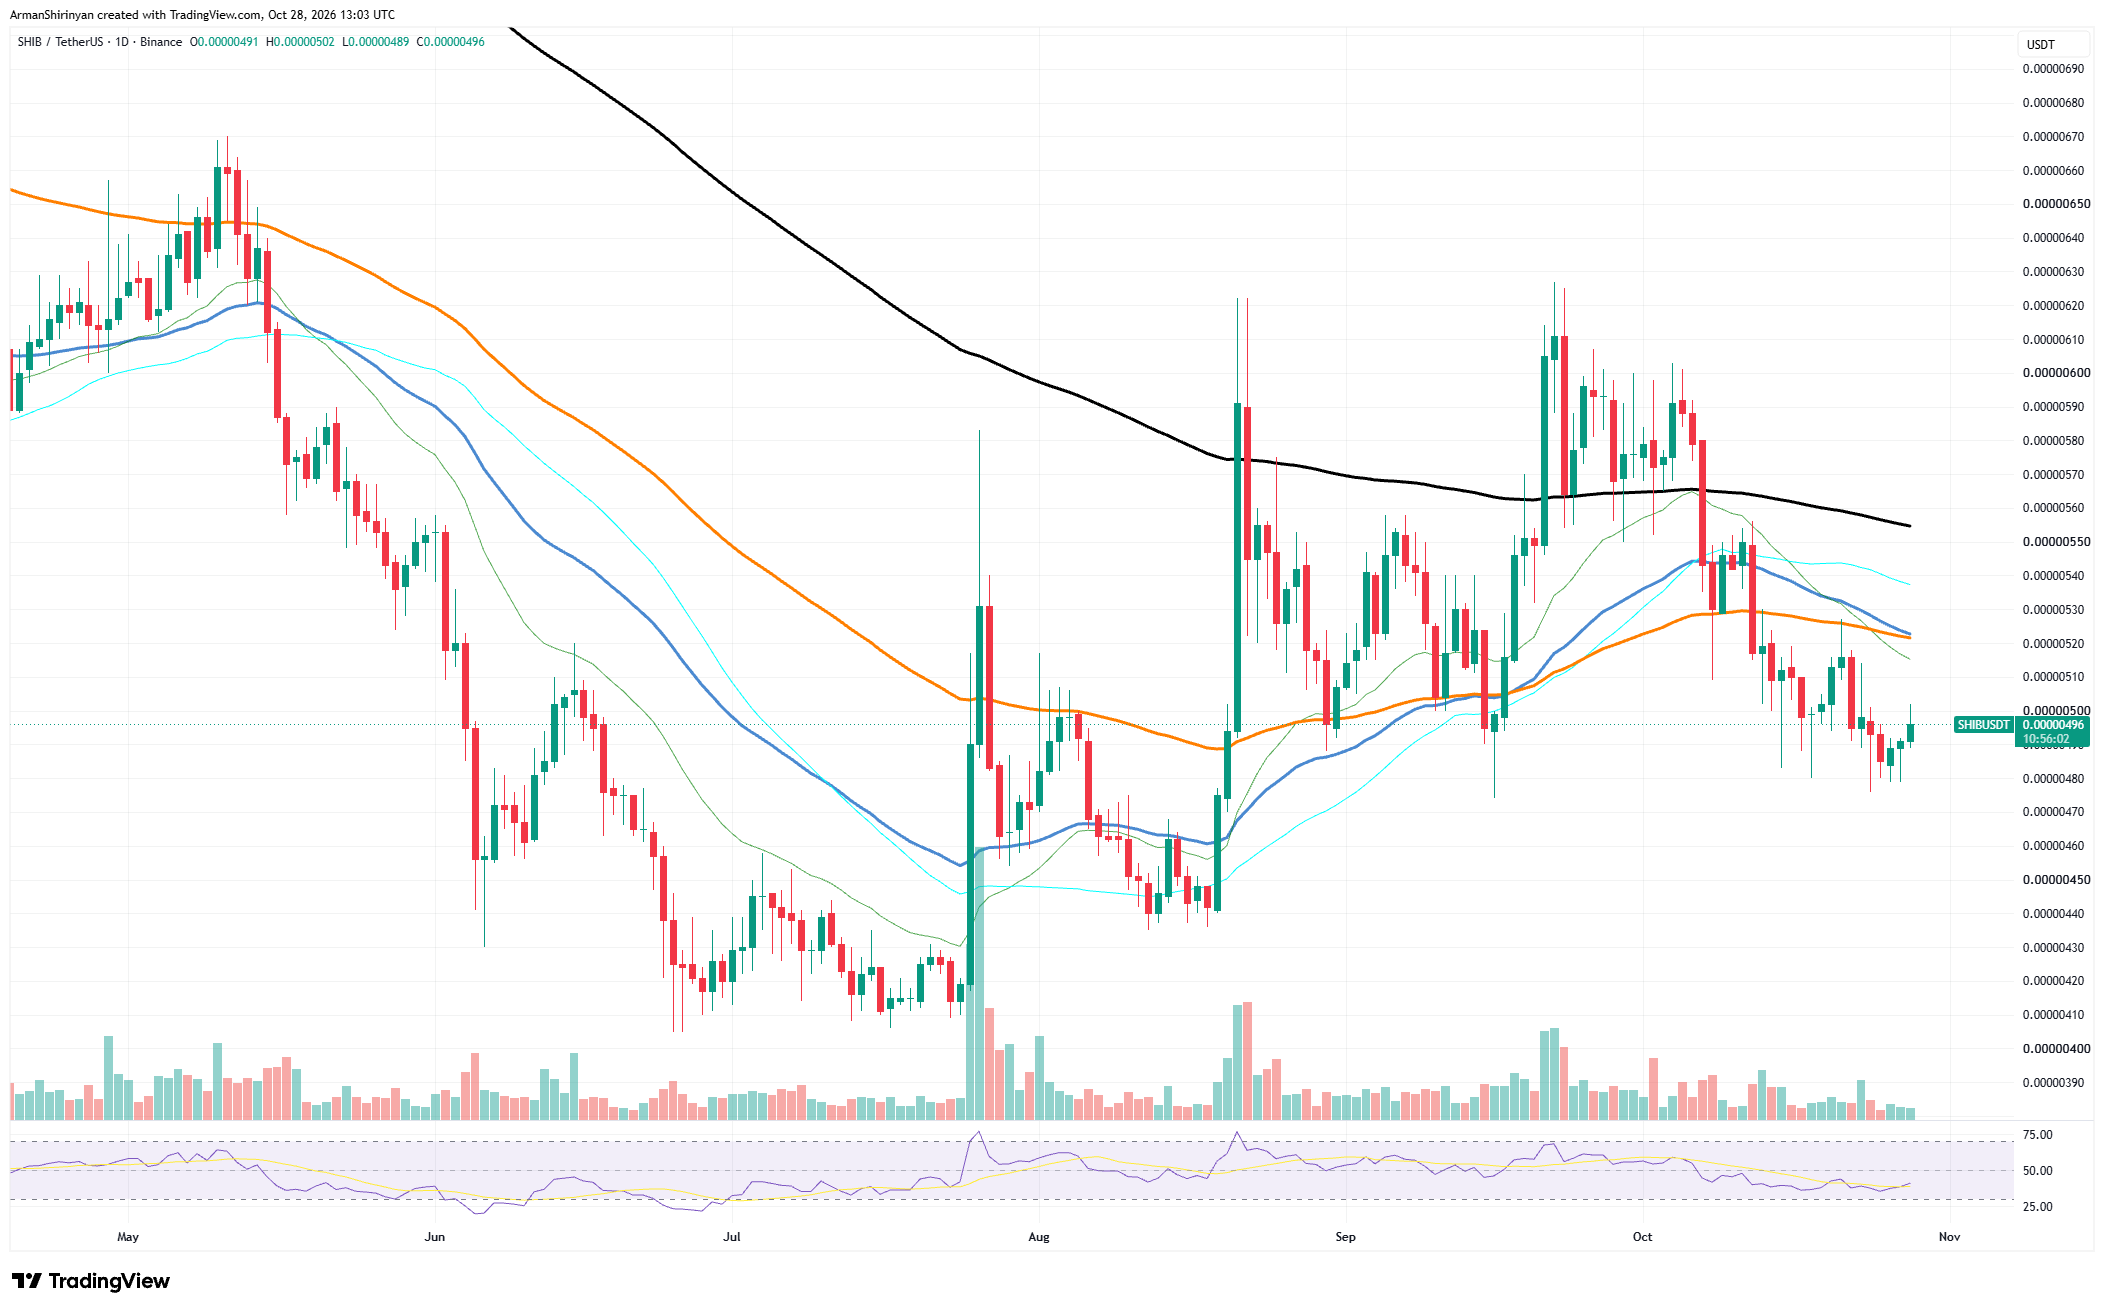
On the daily chart, $SHIB peaked near $0.00000620 in late September and has fallen since then. The price now sits under all major moving averages. The orange line near $0.00000520 and the blue line near $0.00000523 form the primary barrier. The black long-term line near $0.00000555 is much higher and shows how weak the trend remains.
Support is close. The latest low near $0.00000476 has held for several days. If it breaks, the next area to watch is $0.00000450, and below that, $0.00000430.
Weak Volume and Neutral RSI
Trading volume on the chart continues shrinking. The current candles show little interest from buyers or sellers. The RSI sits near 40, which is weak but not oversold, so there is room for more downside before the market looks stretched.
Liquidations over the last 24 hours reached about $20 million, with longs losing $12.9 million and shorts $7 million. Futures flows show small outflows in the short term, and spot flows show net selling over the past hour and four hours.
On OKX, the long-to-short ratio is 2.71, so most traders are betting on a rise. That can turn into a risk if the price falls, because a drop could force many longs to close.
$SHIB needs to reclaim $0.00000520 to show any real recovery. A close above that area with higher volume would be the first good signal. Until then, falling open interest and thin spot demand point to a weak market.
A move under $0.00000476 could push open interest below $37 million and drag the price toward $0.00000450.

 u.today