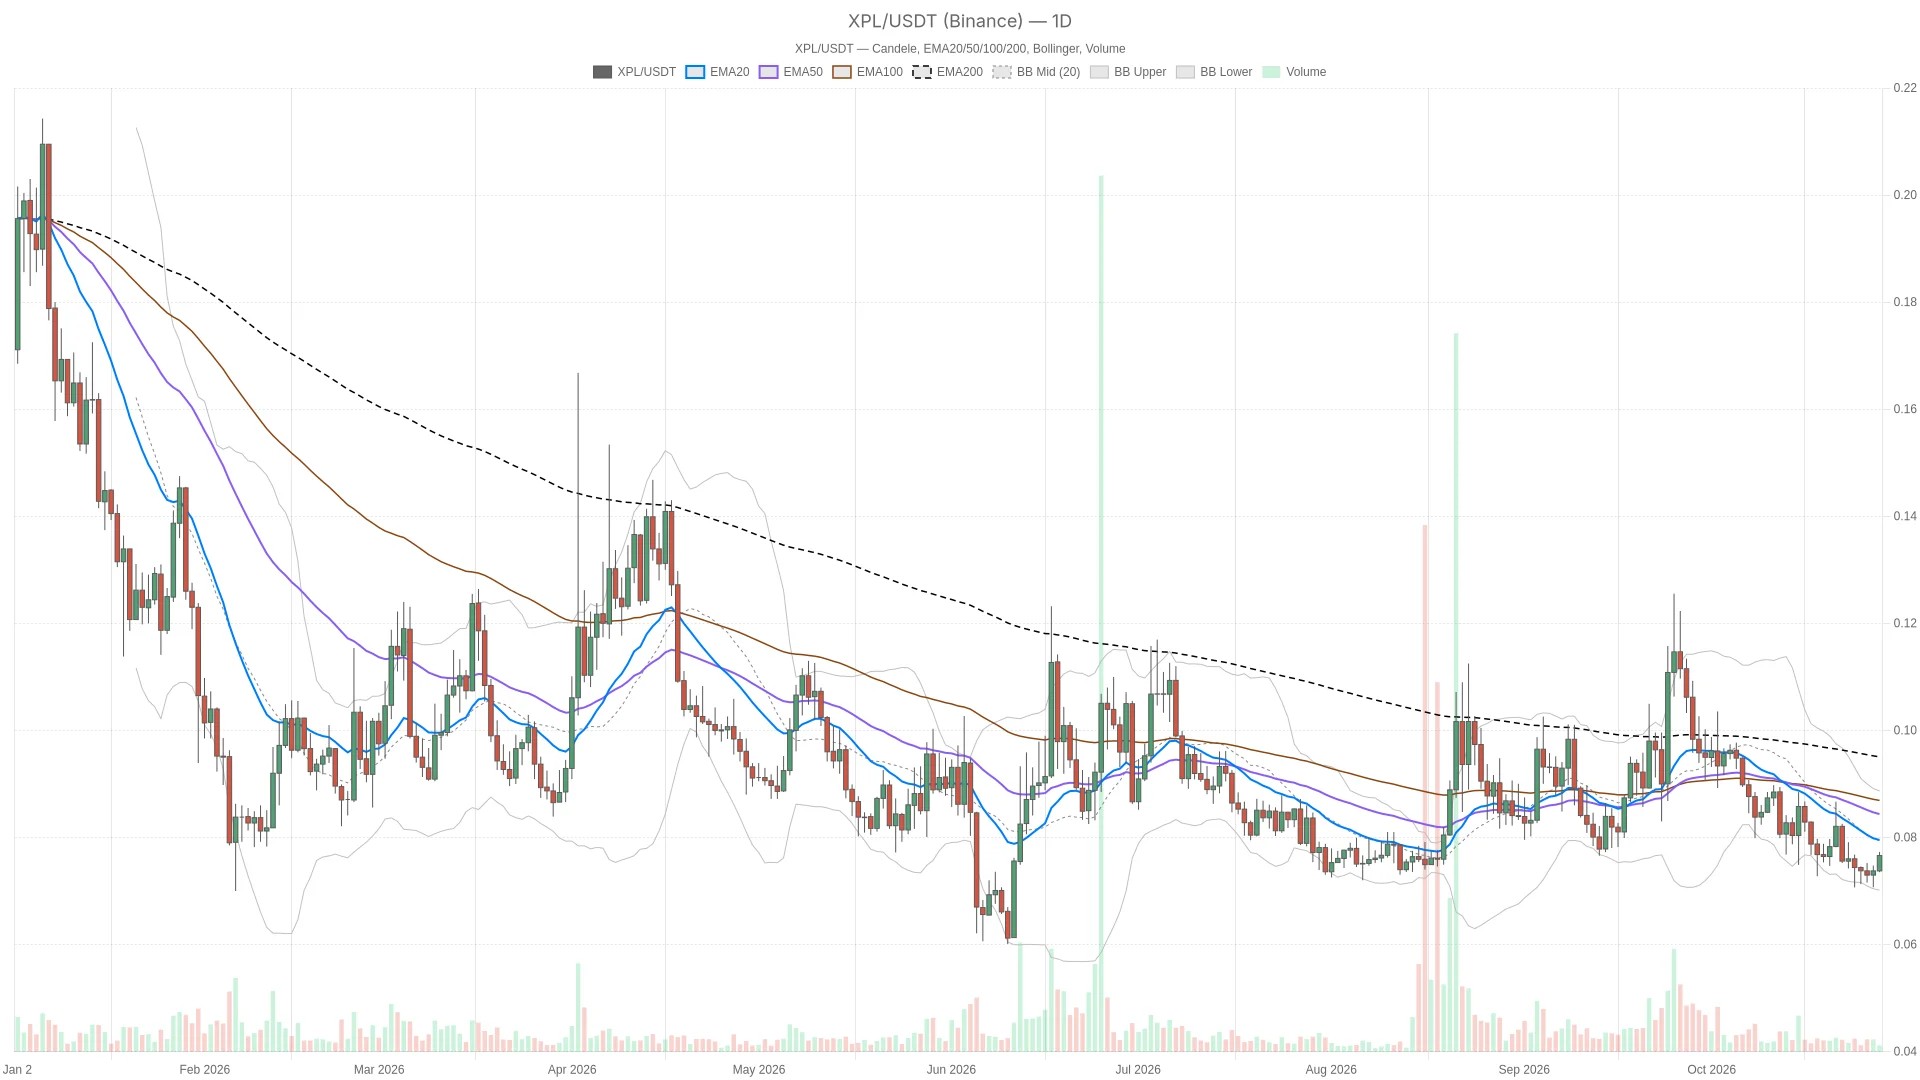
The real tension, however, lies at the next resistance test. Intraday momentum is already overbought, while daily momentum remains weak. Further upside is possible, but a breakout needs to hold beyond the hourly range rather than merely trade through it.
Plasma price scenarios hinge on hourly R1 at $0.07672
$XPL faces two immediate scenarios, both turning on whether price can hold its position relative to hourly R1 at $0.07672.
Bullish scenario: An hourly close above hourly R1 at $0.07672 would confirm a break beyond the nearest overhead level. The last completed hourly candle closed at $0.07644, so that trigger remains unmet. A sustained breakout would bring the daily Bollinger midline at $0.07978 and daily EMA20 at $0.07984 into focus. An hourly close back below the hourly pivot at $0.07638 would invalidate this immediate continuation setup.
Bearish scenario: An hourly close below the hourly pivot at $0.07638 would signal that the rebound is losing its immediate footing. The next downside references are the hourly Bollinger upper band at $0.07615 and hourly S1 at $0.07611, followed by the hourly EMA200 at $0.07564. An hourly close above hourly R1 at $0.07672 would invalidate this breakdown setup.
On the daily map, price is already above daily R1 at $0.07545, making that level support rather than a pending upside trigger. Below it, the daily pivot at $0.07307 and daily S1 at $0.07139 define deeper support. The likeliest false signal is an intraday push through hourly R1 that fails to hold: stretched short-term momentum makes a brief breakout less persuasive than a completed hourly close. These scenarios describe the immediate range; neither alone establishes a reversal of the daily trend.
Overbought intraday RSI conflicts with weak daily reading
Intraday RSI readings have entered overbought territory while the daily RSI remains bearish, creating a genuine timeframe conflict for $XPL.
Binance-derived daily RSI stands at 38.4, keeping the broader momentum balance on the bearish side. Hourly RSI has risen to 71.0, while the 15-minute reading has climbed to 77.6. Both intraday readings are overbought. For $XPL, that is a genuine timeframe conflict: the recovery has strength locally, but it is stretched before the daily chart has turned constructive. The 15-minute reading is execution context, not evidence that the macro bias has changed.
MACD offers a more constructive nuance. The daily histogram remains negative but is narrowing toward zero, indicating that downside momentum is easing rather than reversing outright. The hourly and 15-minute histograms are positive and widening. Together, these readings support the rebound while stopping short of confirming a daily trend change.
Daily averages remain bearish despite intraday strength
The daily EMA structure remains bearishly aligned despite $XPL trading above its intraday averages.
The daily EMA structure is bearishly aligned, with price below the EMA20 at $0.07984, EMA50 at $0.08469 and EMA200 at $0.09524. That ordering keeps the main scenario bearish: recovery has not yet repaired the broader trend structure.
On the hourly chart, price is above the EMA20, EMA50 and EMA200, but those averages are not aligned. The distinction matters: price has recovered above its reference averages without establishing a textbook bullish hourly structure. On the 15-minute chart, price is above all three averages and their ordering is bullish, reinforcing the stronger execution-timeframe picture without overruling the daily chart.
The daily Bollinger envelope runs from $0.07042 to $0.08914, with price still below its midline. Meanwhile, price is above the hourly upper band, consistent with the stretched intraday momentum. The daily ATR is $0.006516, compared with an hourly ATR of $0.0008659 and a 15-minute ATR of $0.0003965. The broader movement range is substantial relative to the narrow hourly trigger area; crossing a nearby level is not, by itself, proof of durable acceptance.
Neutral sentiment offers no decisive backdrop for $XPL
Market sentiment sits at Neutral, offering no decisive direction for $XPL’s immediate price action.
The Fear & Greed Index is classified as Neutral. CoinGecko puts total crypto market capitalization at $2.72 trillion and Bitcoin dominance at 60.02%. Those readings provide context, not an $XPL-specific catalyst. Neutral sentiment does not resolve the conflict between the bearish daily structure and stronger intraday momentum.
FAQ
Is $XPL’s rebound a confirmed bullish reversal?
No. The daily EMA structure remains bearish, while the intraday readings show a stronger but overbought recovery.
Does an overbought RSI confirm that $XPL must fall?
No. Positive, widening intraday MACD histograms still support the rebound; overbought RSI makes a failed breakout a risk, not a certainty.
Disclaimer: This article is for informational purposes only and does not constitute financial advice, an investment recommendation, or a solicitation to buy or sell any financial instrument or cryptocurrency. The analysis provided is not indicative of future results. Investing in crypto assets and financial markets carries a high risk of capital loss. Always do your own research (DYOR) and consult a qualified financial advisor before making any decision.
Article produced with the assistance of artificial intelligence and reviewed by the editorial team.

 en.cryptonomist.ch