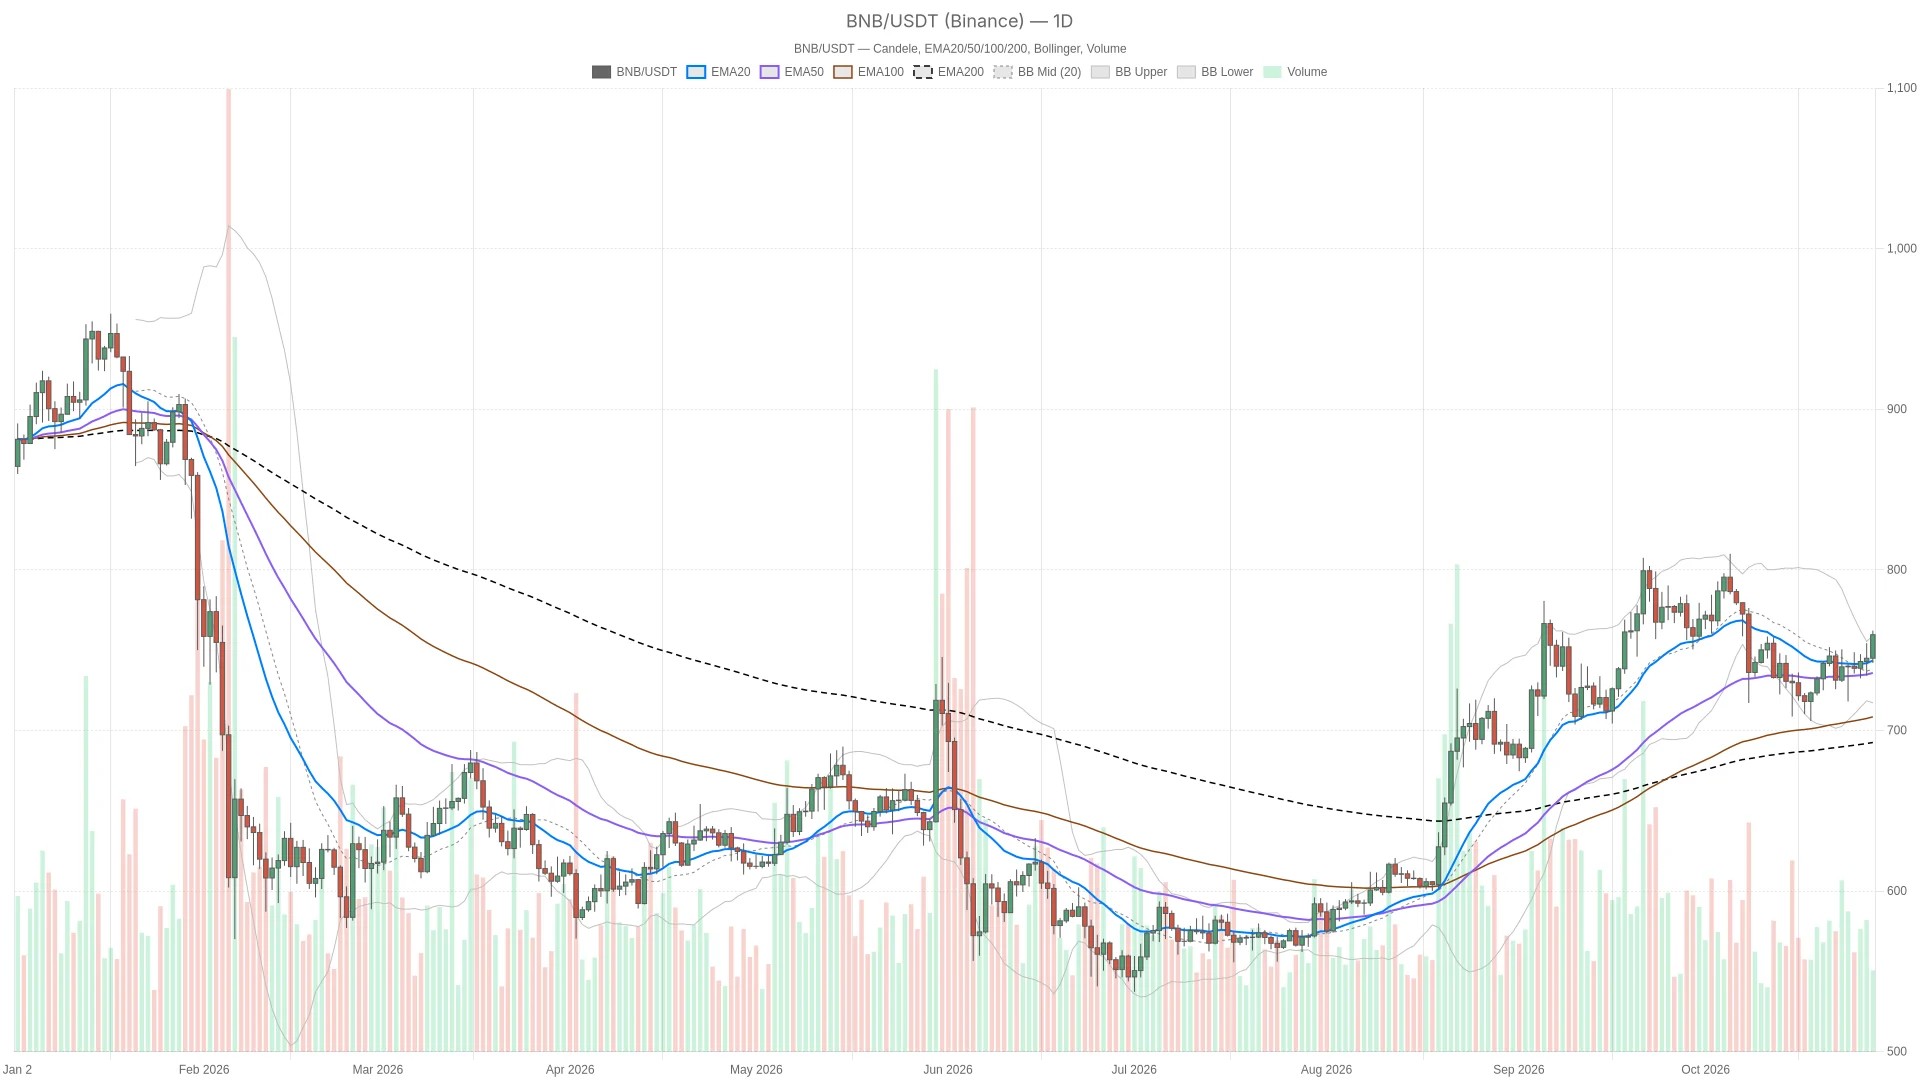
$BNB Binance price: daily strength meets short-term exhaustion risk
The daily chart supplies the main bullish scenario. Its moving averages are aligned bullishly, and momentum on completed candles is improving. The hourly chart broadly confirms that direction rather than contradicting it.
The tension appears in execution. The live hourly candle trades at $759.30, below its last completed close of $760.86. On the 15-minute chart, the live price is $758.87, also below that same completed close. Those are open-candle prices, not confirmed closing breakdowns. Still, the 15-minute momentum evidence is less supportive of immediate continuation than the daily and hourly readings.
Bullishly aligned averages support the trend, but price exceeds the daily band
$BNB is above the daily EMA20 at $741.79, EMA50 at $734.78, and EMA200 at $691.81. Their bullish alignment gives the advance a coherent underlying structure: a modest retreat could occur without disturbing the broader trend.
The same alignment holds intraday. Price is above the hourly EMA20 at $749.05, EMA50 at $745.43, and EMA200 at $739.51, and above the 15-minute EMA20 at $754.35, EMA50 at $750.29, and EMA200 at $745.02. Both sets are bullishly stacked. There is no moving-average disagreement across these horizons; the concern is how far price has extended, not a bearish crossover.
The daily Bollinger upper band at $755.34 is now below price, making it a nearby support reference rather than overhead resistance. The daily midpoint is $736.91 and the lower band is $718.47. Trading outside the upper envelope demonstrates strength, but also leaves room for mean reversion without requiring a wholesale trend reversal.
Price is also above the hourly upper band at $758.07, while the 15-minute price remains below its upper band at $763.62. That combination leaves the broader intraday move extended even as the shortest chart trades inside its envelope.
Daily ATR is $19.74, compared with $3.75 hourly and $1.98 on the 15-minute chart. These readings put the nearby pivot tests in perspective: a brief move through a level can occur within ordinary candle volatility and is not, by itself, decisive confirmation.
RSI is stretched intraday while MACD separates trend from execution
Daily RSI is rising at 51.2, giving the bullish bias momentum support without a daily overbought reading. Hourly RSI is rising at 75.8, and 15-minute RSI is rising at 80.8. Both intraday readings are overbought. The contrast is important: the daily recovery is not stretched by this measure, but its short-term expression is.
Daily MACD adds a qualified positive. Its histogram is positive and widening, although the MACD line remains below zero. Momentum is improving, but that is not the same as an unambiguously strong daily momentum regime.
The hourly MACD histogram is also positive and widening, reinforcing the bullish structure. On the 15-minute chart, however, the positive histogram is narrowing even as RSI rises. That divergence between the indicators weakens the case for immediate acceleration; it does not yet establish a bearish trend.
The hourly pivot separates consolidation from a renewed breakout
The nearest hourly resistance is the hourly pivot at $760.32, followed by hourly R1 at $762.74. The last completed hourly candle already closed above the pivot, so a pivot breakout is not a still-pending signal. The live move back below it instead puts the durability of that reclaim under scrutiny.
Immediate support is hourly S1 at $758.44, followed by the hourly Bollinger upper band at $758.07. Below those references, the daily Bollinger upper band at $755.34 and daily R1 at $754.79 form the next support area. Despite its R1 label, that daily level is below the current price. The daily pivot at $744.44 is a deeper structural reference, not the immediate intraday test.
Bullish scenario: an hourly close above hourly R1 at $762.74 would confirm an extension beyond the nearest listed hourly resistance. An hourly close below hourly S1 at $758.44 would invalidate that immediate continuation setup. The likeliest false bullish signal is a brief push above resistance that fails to hold into the close, particularly with intraday RSI already overbought.
Bearish scenario: an hourly close below hourly S1 at $758.44 would activate the pullback case, exposing the hourly upper band before the nearby daily support area. An hourly close back above the hourly pivot at $760.32 would invalidate that breakdown setup. The main false bearish signal would be a temporary support breach followed by a reclaim, while the daily moving-average structure remains bullish.
Mixed BSC trading volumes do not confirm broad-based acceleration
Chain-wide 24-hour DEX trading volume across the BSC blockchain stands at $925,206,012.09. These are chain-wide trading volumes, not $BNB-specific turnover, fees, or revenue, so they cannot establish demand for $BNB itself.
The venue picture is mixed. One-day trading volume fell 4.82% on PancakeSwap AMM V3 and 15.61% on PancakeSwap Infinity, while Uniswap V4 increased 73.90% and PancakeSwap AMM increased 20.83%. That dispersion does not support a blanket claim that activity is accelerating across venues.
$BNB Chain’s third-quarter growth included an increase in smart-contract deployments, while CZ discussed the chain’s role in AI. Those developments provide ecosystem context for the bullish technical structure, but the supplied information does not establish either as the cause of the current price move.
Neutral sentiment leaves $BNB without a clear market-wide tailwind
Alternative.me’s Fear & Greed Index stands at 51, classified as Neutral. That reading offers no strong sentiment endorsement of either a breakout or a reversal.
CoinGecko places total cryptocurrency market capitalization at $2.72 trillion and Bitcoin dominance at 60.02%. These are current market levels, not evidence of a directional change in dominance. In this backdrop, the bullish thesis for $BNB rests primarily on its own technical structure rather than a demonstrated market-wide risk-on impulse.
FAQ
Are the quoted live prices completed candle closes?
No. The live daily, hourly, and 15-minute prices belong to candles still open. The indicators use completed candles, so an intrabar move should not be treated as a confirmed closing signal.
Is the BSC DEX volume a measure of $BNB revenue?
No. The volume figures measure chain-wide decentralized-exchange trading volume. They are neither $BNB revenue nor $BNB-specific trading volume.
Disclaimer: This article is for informational purposes only and does not constitute financial advice, an investment recommendation, or a solicitation to buy or sell any financial instrument or cryptocurrency. The analysis provided is not indicative of future results. Investing in crypto assets and financial markets carries a high risk of capital loss. Always do your own research (DYOR) and consult a qualified financial advisor before making any decision.
Article produced with the assistance of artificial intelligence and reviewed by the editorial team.

 en.cryptonomist.ch