Here Are the Two Key Fibonacci Barriers XRP Must Breach Before Hitting $2
thecryptobasic.com
3 h
$XRPwould need to breach two important Fibonacci barriers before bulls can push prices toward the elusive $2 level.
$XRP is trying to regain its upward momentum after the latest market-wide sell-off, rising above $1.30 to trade at $1.3232 at the time of writing. The token has gained 2.19% on the current weekly candle, but still faces major resistance before it can return to $2.
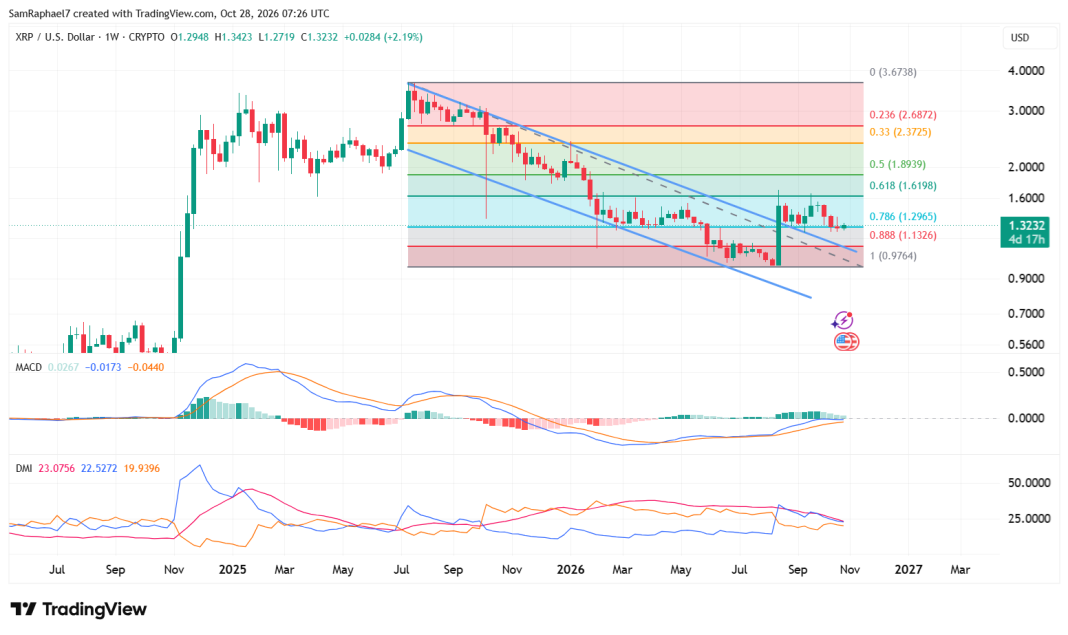
An analysis of the weekly chart shows two key Fibonacci retracement levels at $1.6198 and $1.8939 that $XRP must break above to strengthen its recovery and move closer to the $2 mark.
Know when your coins move
Alerts, real-time prices, and market news — all in one app
Point your phone camera to install
4.8 based on 40K reviews in the App Store and Google Play
The $XRP Fibonacci Structure
The weekly Fibonacci retracement measures $XRP’s decline from its 2025 peak of $3.67 to the August 2026 low of $0.9764. This range identifies several price levels that traders can watch as potential resistance during a recovery.
Above the current price, the main levels are the 0.618 Fibonacci retracement at $1.6198, the 0.5 level at $1.8939, the 0.33 level at $2.3725, and the 0.236 level at $2.6872.
$XRP dropped below $2 during the week ending Jan. 25, 2026, and has remained below that level since then. Throughout the year, the token has struggled to recover from the lower end of this price range.
It now trades just above the 0.786 Fibonacci level at $1.2965, which serves as immediate support for the current rebound. If $XRP falls below this level, the next support sits at the 0.888 retracement of $1.1326.
The 1.0 Fibonacci level at $0.9764 marks the bottom of the range. $XRPcame close to testing this level in August 2026, when its price fell to $0.98 before buyers stepped in and stopped the decline.
First $XRP Fibonacci Barrier
The first major hurdle on $XRP’s path to $2 is the 0.618 Fibonacci retracement at $1.6198, called the golden ratio.
Sellers often become more active around this level, and this makes it harder for prices to continue rising. From its current price of $1.3232, $XRP needs to gain approximately 22% to reach this area.
$XRP FIbonacci levels show two price areas to breach before rally to $2
Recent price movements show why this level could prove difficult to overcome.$XRP climbed to $1.6581 in late September 2026, but sellers soon pushed the price below $1.50.
This decline suggests that selling pressure remains strong around that region. A weekly close above $1.62 would provide a stronger sign that buyers are gaining control and that the market structure may be changing.Until $XRPachieves that close, the $1.6198 area remains a major barrier to further gains.
The Second $XRP Fibonacci Barrier
If $XRP breaks above the 0.618 Fibonacci level, its next major challenge will be the 0.5 retracement at $1.8939. This midpoint of the measured price range could attract increased buying and selling as traders respond to $XRP approaching the $2 mark.
To reach $1.8939, $XRP would need to rise approximately 43% from its current price of $1.3232. A move above this level would clear the final major Fibonacci hurdle before $2 and strengthen the case for a continued recovery.
The ongoing Ripple Swell conference in New York City could also affect market sentiment during the current weekly candle. The event is the largest in Ripple history and features more than 75 speakers from institutions such as BNY and Nasdaq.
Major announcements from the conference could renew interest in $XRP and help push its price toward $1.6198, followed by a possible move toward $1.8939. If $XRP clears $2, the next Fibonacci levels to watch are $2.3725 and $2.6872, which correspond to the 0.33 and 0.236 retracements, respectively.
Technical Indicators Show Weakening Trend
Meanwhile, the weekly MACD histogram remains green, suggesting that $XRP still has some upward momentum. However, the bars are getting smaller, and this indicates that buying pressure is weakening rather than growing.
The MACD line stands at 0.0267, while the signal line is at -0.0173. Although the positive histogram leaves room for further gains, its shrinking bars suggest that buyers need to regain strength to support a move toward the first Fibonacci resistance at $1.6198.
The Directional Movement Index (DMI) also shows signs of weakening bullish momentum. The positive directional indicator (+DI) stands at 22.52 and is declining, while the negative directional indicator (-DI) reads 19.93 and is gradually rising.
As the two indicators move closer together, the gap between buying and selling pressure narrows, suggesting that buyers are losing some control. Meanwhile, the Average Directional Index (ADX) stands at 23.07 and is trending lower, indicating that the current trend lacks strength in either direction.

 thecryptobasic.com