The yearly chart makes this clear. The ledger has seen many sharp spikes over the last twelve months, some reaching 2.5 billion $XRP in a single day. The all-time high is 7 billion. Compared with those peaks, the recent jump was small. It seemed large only because it started from a very low base.
Price Shows the Same Weakness
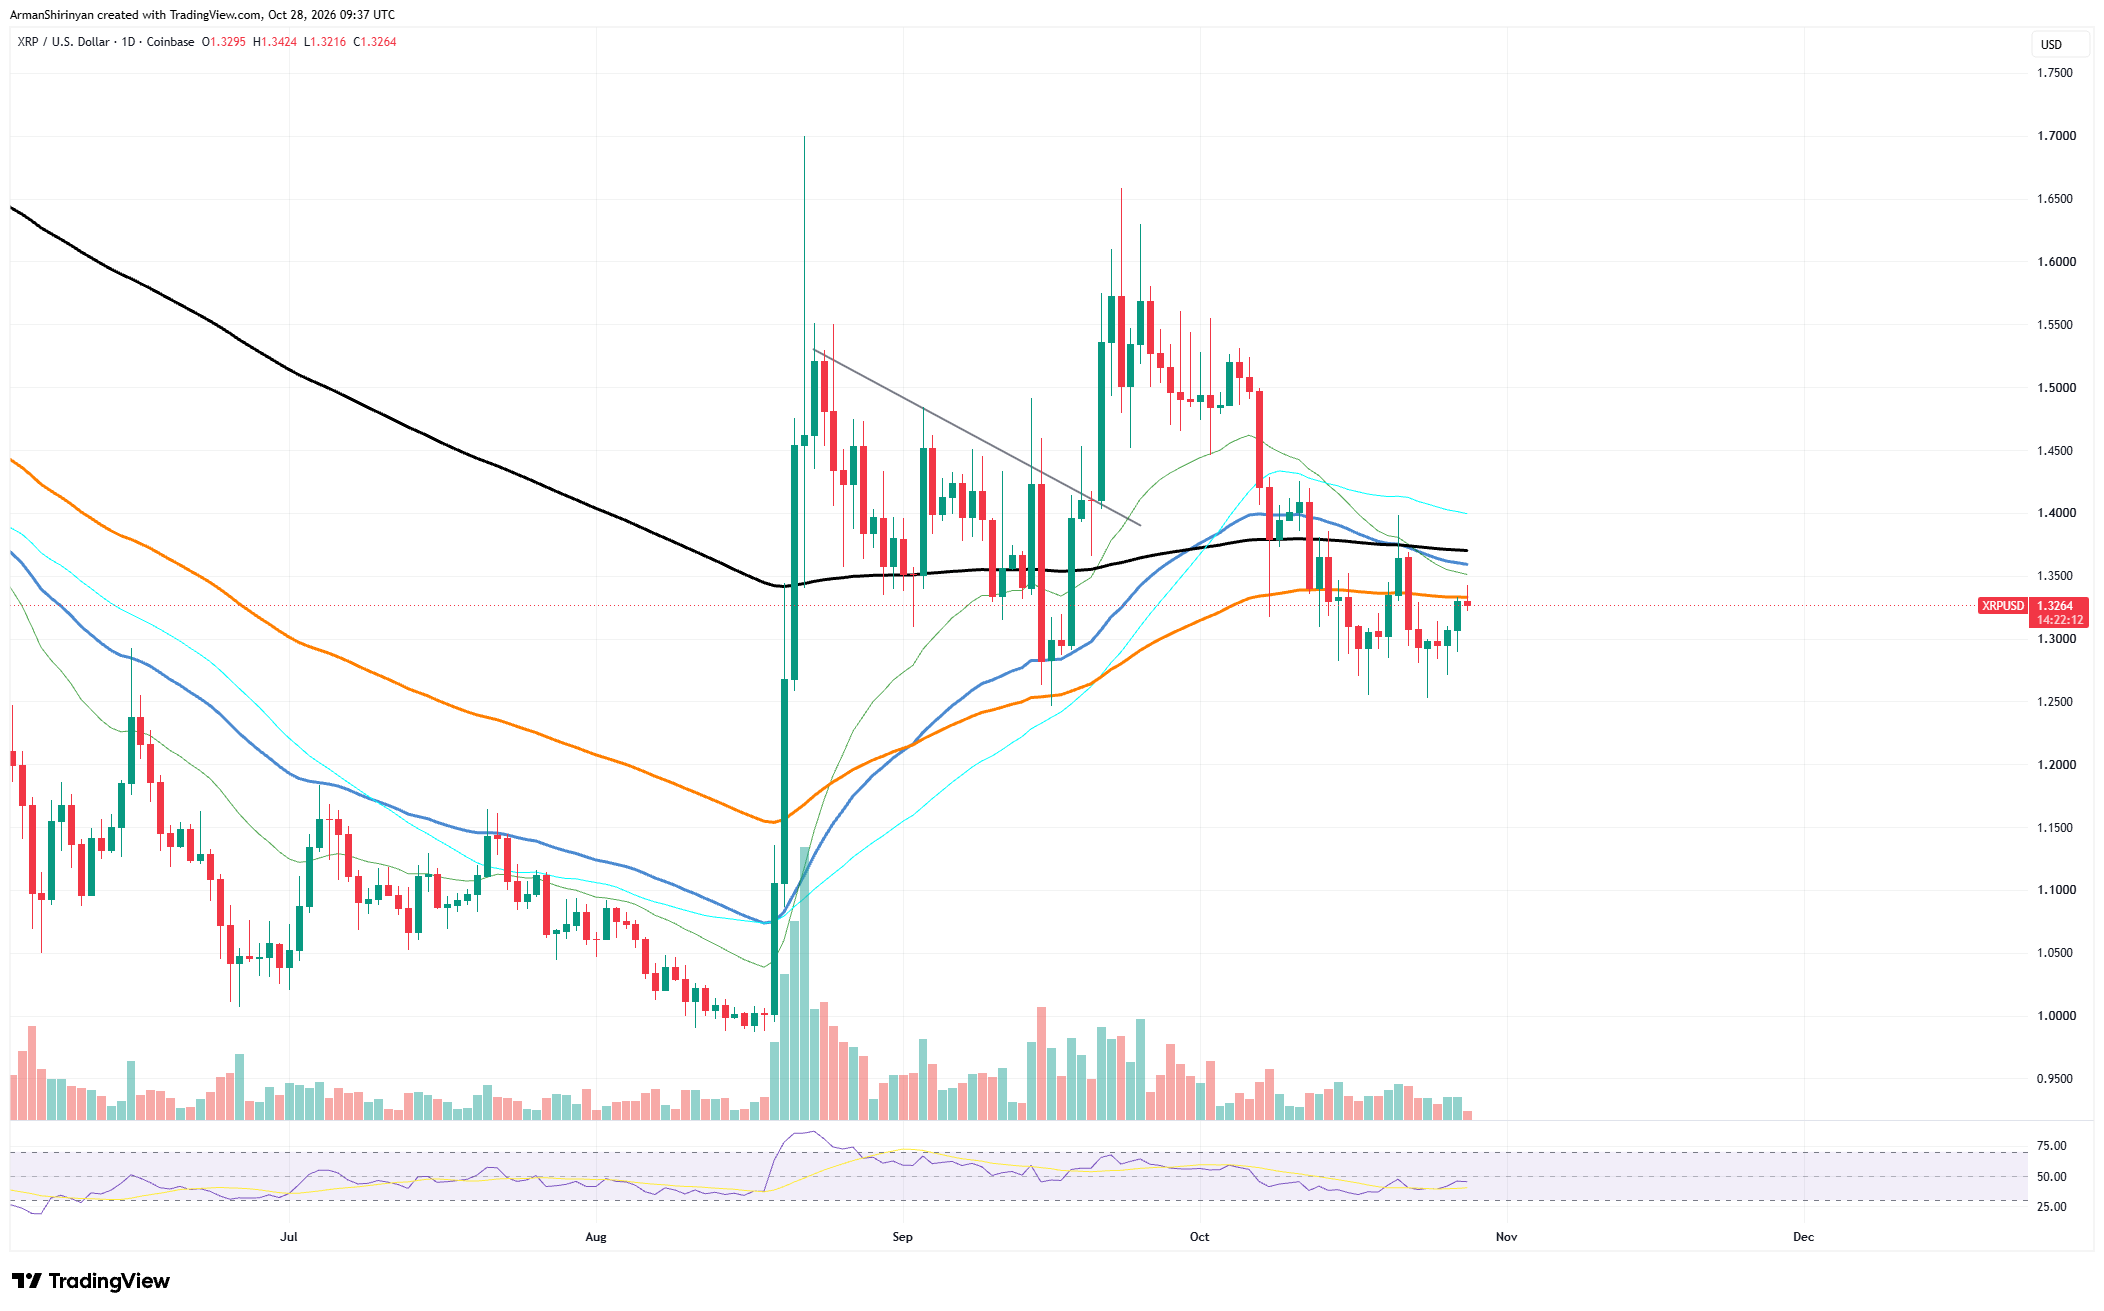
The price chart tells the same story. $XRP trades near $1.33 on the daily chart. After rising to about $1.65 in late September, it fell back below $1.30 in mid-October and has only bounced slightly since. The coin is now stuck beneath a cluster of moving averages. The orange line near $1.33 is acting as the first barrier. Above it, the black and blue lines sit between $1.36 and $1.38, forming a harder zone. Until $XRP closes above that region, the trend remains weak.
Trading volume supports this view. It has dropped steadily since the early October sell-off, and the latest candles show little buying interest. The RSI sits near 48, which is neutral. It indicates neither strength nor panic.
The ledger data indicates that buyers did not follow the burst of activity. A real move usually needs several days of rising volume and price. Here, the price stayed flat while on-chain numbers jumped, and then both cooled down.
Support sits near $1.25, where buyers stepped in twice in October. If that level breaks, the next area to watch is $1.10. On the upside, $XRP needs to clear $1.38 with strong volume to change the picture.
For now, the 2,633% headline looks impressive but means little. The market has not shown the follow-through needed to turn a brief spike into a lasting trend.

 u.today