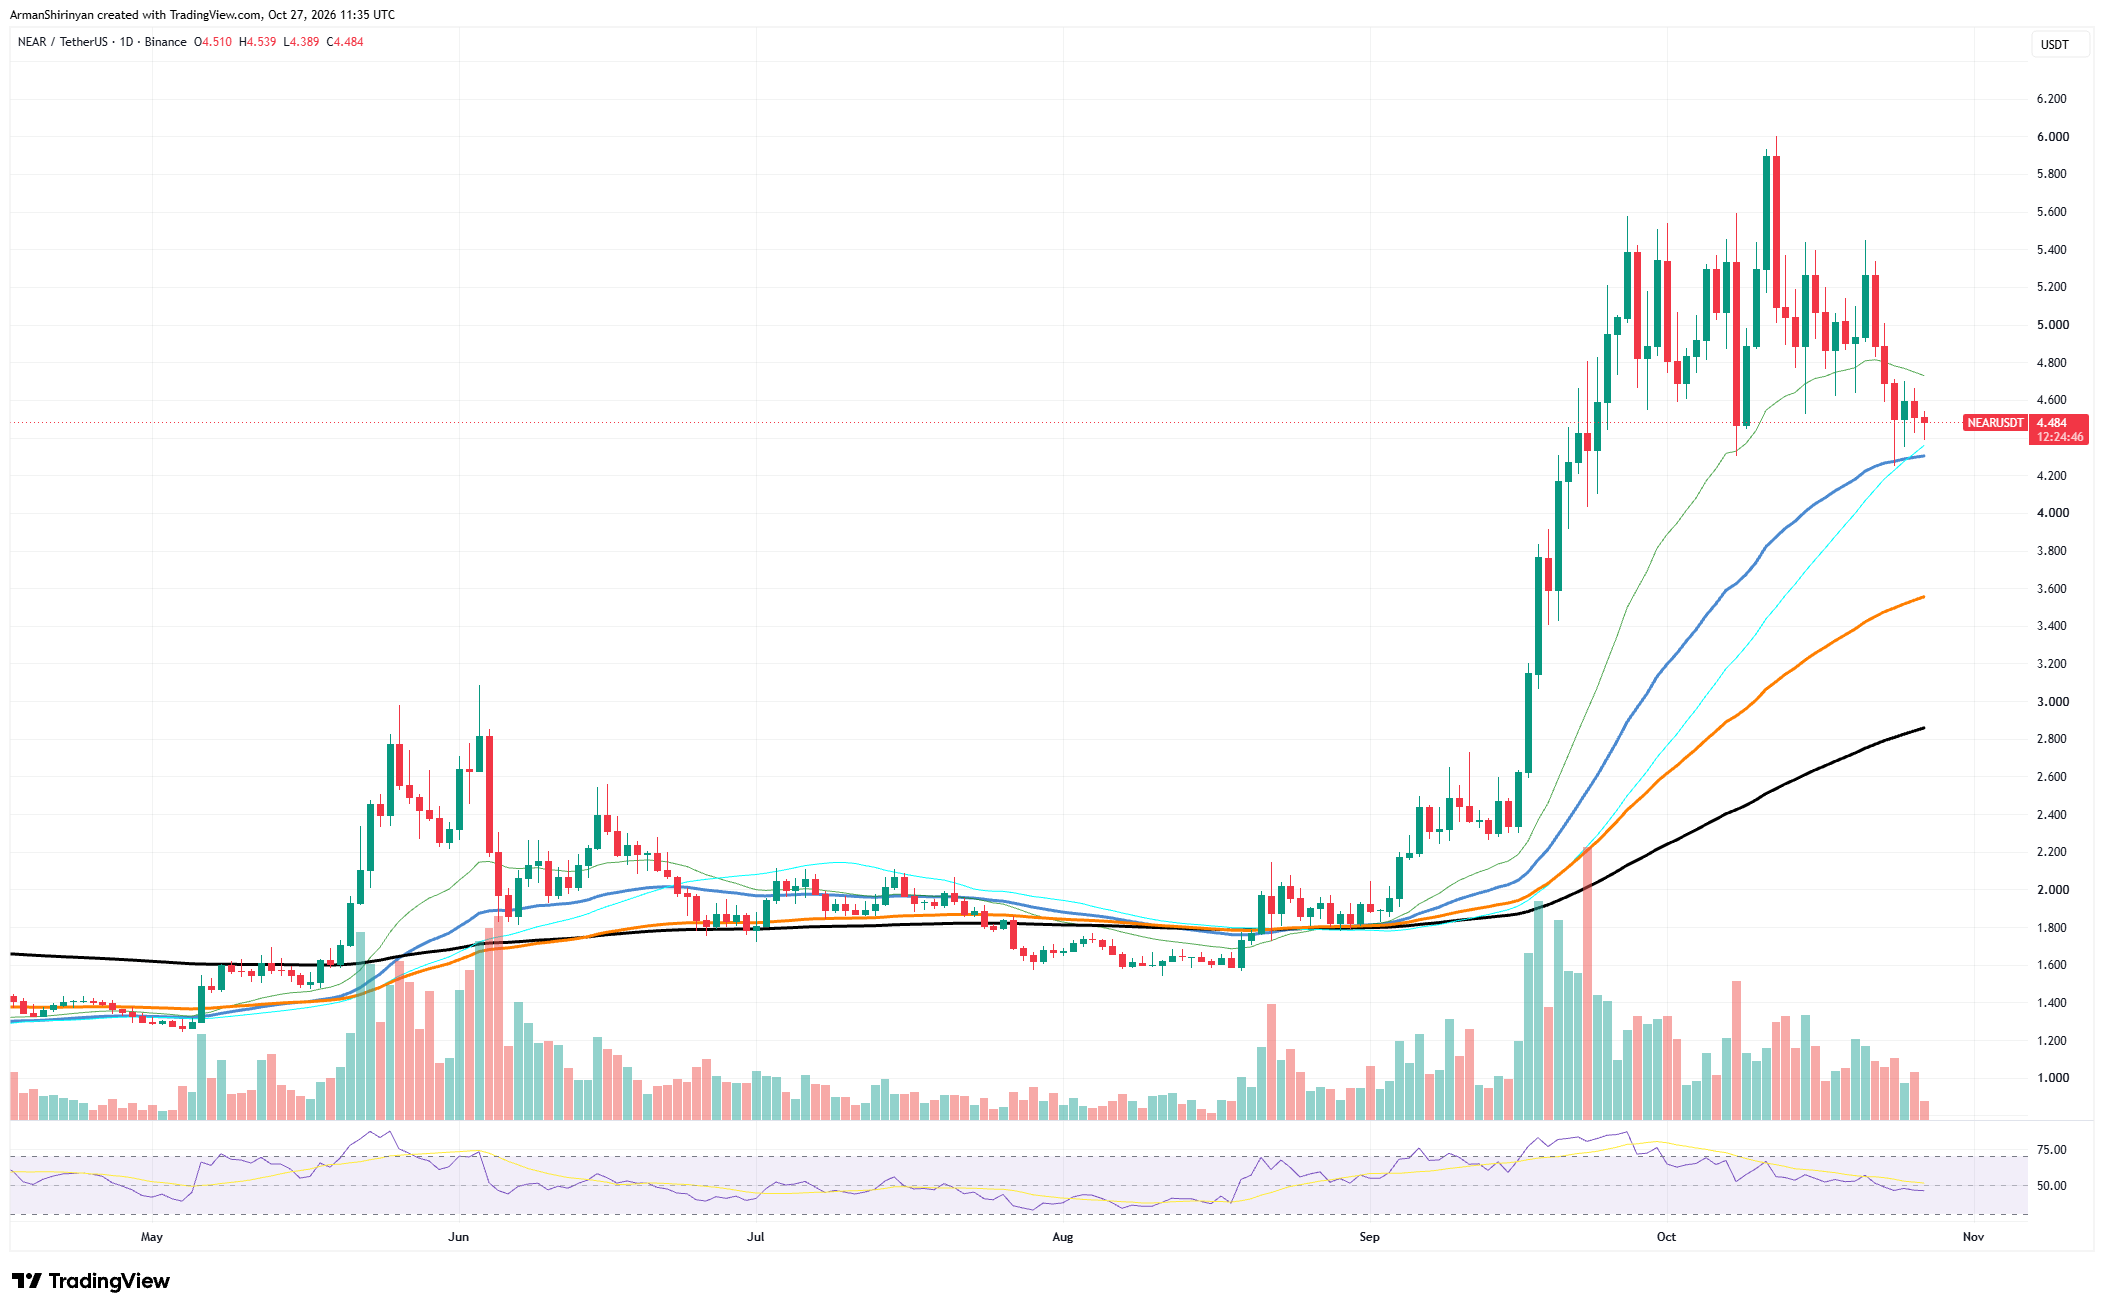
So far, they are defending it. $NEAR touched $4.389 today and bounced right on the 50-day moving average, which sits near $4.30. This line has supported the price through the entire climb, and the market is respecting it again. The inflow arriving at this specific spot shows buyers see the dip as an opportunity to buy, not a reason to sell.
Are bulls in control?
The larger trend still favors bulls. All the long-term moving averages point up and sit well below the price. The 100-day average is near $3.55 and the 200-day average is near $2.86. The gap between price and these lines is wide, which shows how strong the rally was. It also means a deeper fall would have plenty of room to run if $4.30 breaks.
There are weak points to watch. Trading volume has dropped over the last few weeks, and the daily candles have become smaller. That points to a market that is waiting, not one ready to bounce. The RSI is near 48, which is neutral. The overheated readings from September are gone, and that gives the price room to move higher without being stretched.
The levels are clear. Support is at $4.30, then $4.00, then the 100-day line near $3.55. A close below $4.30 would put the entire October jump in doubt. On the upside, the first hurdle is the short-term average near $4.73. Above that, $5.00 and $5.40 are the next zones where sellers appeared before, and $6.00 remains the main target.
A 130% jump in inflow does not guarantee a recovery, but it shows real demand at an important support. If the money keeps coming and $NEAR holds above $4.30, a move back toward $5.00 becomes the most likely next step.

 u.today