The distinction matters here. Hourly price strength supports the recovery case, yet momentum is not fully cooperating. A move through nearby resistance needs confirmation on completed candles; strength on the execution timeframe alone would not settle the daily picture.
A weaker broad market keeps the recovery in context
The broader market offers a defensive backdrop for $NIGHT’s recent price action. CoinGecko puts total crypto market capitalization at $2.69 trillion, down 2.26% over 24 hours, with Bitcoin dominance at 59.43%. That broader decline provides a defensive context, although it does not establish the cause of $NIGHT’s price action.
Alternative.me’s Fear & Greed Index reads 48, classified as Neutral. Sentiment therefore offers no clear directional endorsement of the recovery. The asset’s own structure remains the more useful guide.
Midnight price structure is stronger below the daily timeframe
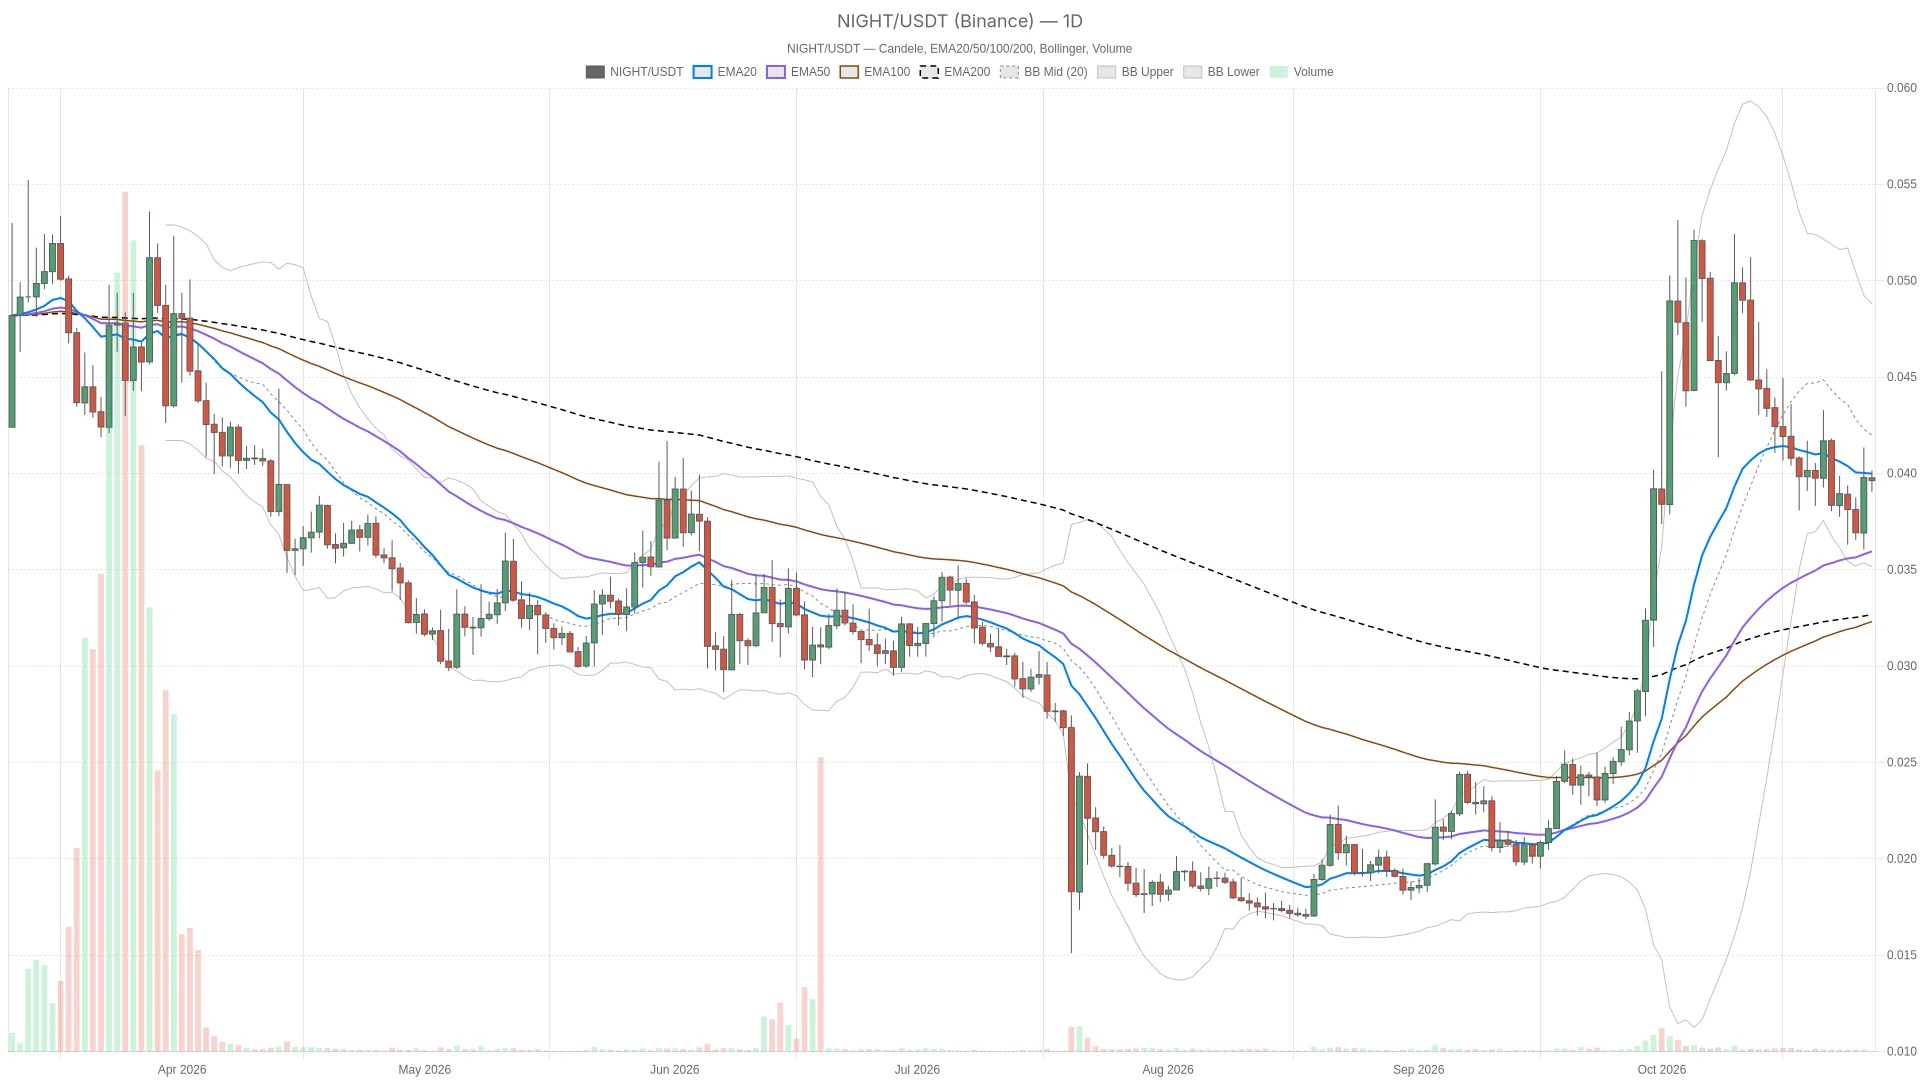
$NIGHT’s daily EMA order remains bullish, but the incomplete price recovery keeps the daily bias neutral. Binance candle data show a bullish daily EMA order, yet price has not reclaimed the shortest average. $NIGHT is below the daily EMA20 at $0.04003, while remaining above the daily EMA50 at $0.03581 and daily EMA200 at $0.03260. The averages are bullishly stacked, but the gap between price and the EMA20 supports a neutral daily bias rather than an outright bearish trend call.
Meanwhile, the hourly chart strengthens the recovery case without fully confirming it. Price is above the hourly EMA20 at $0.03931, hourly EMA50 at $0.03862 and hourly EMA200 at $0.03918. Those averages are not aligned, however, so trading above them is evidence of local strength rather than a textbook bullish hourly structure.
On the 15-minute chart, price is also above the EMA20, EMA50 and EMA200, and their order is bullish. That supports execution-level strength, but it cannot override the unresolved daily barrier. The tension is straightforward: shorter-term structure is constructive while the daily chart still demands proof.
Improving daily momentum meets weaker hourly follow-through
Daily momentum shows stabilization rather than a breakout, with RSI rising at 51.2 and the negative MACD histogram narrowing. The negative daily MACD histogram is narrowing, yet a negative histogram does not establish bullish momentum. Together, these readings fit stabilization better than a decisive breakout.
Hourly RSI is also rising, at 58.5, but the hourly MACD histogram is negative and widening across the supplied completed readings. These signals conflict: relative strength is constructive, while MACD momentum weakens the case for immediate continuation.
Moreover, the execution chart is split in the opposite direction. The 15-minute MACD histogram is positive and widening, while RSI is falling at 48.4. That makes a brief upward push less persuasive unless the hourly chart confirms it.
The daily Bollinger midpoint at $0.04230 remains above price, between the lower band at $0.03536 and upper band at $0.04924. $NIGHT is therefore below the center of its daily volatility envelope, reinforcing the view that this is a recovery attempt rather than established upside control. On the hourly chart, price is above the Bollinger midpoint at $0.03951 but below the upper band at $0.04141: local strength has not yet reached that upper boundary.
Daily ATR is $0.003725, versus hourly ATR of $0.0006774. These ranges put the tightly spaced nearby levels in perspective: crossing one intraday threshold is not, by itself, strong evidence of a durable change in direction.
Hourly pivot and R1 define the bull and bear triggers
The $NIGHT setup turns first on the hourly pivot at $0.03958 below price and hourly R1 at $0.03998 above it. The daily EMA20 at $0.04003 sits just beyond that resistance. The daily pivot at $0.03907 is the next broader structural reference below the nearby hourly supports.
Bullish scenario: An hourly close above hourly R1 at $0.03998 would confirm a local resistance break. The daily EMA20 at $0.04003 would then be the immediate test, with the hourly Bollinger upper band at $0.04141 and daily R1 at $0.04207 farther above. An hourly close back below the hourly pivot at $0.03958 would invalidate that local breakout scenario.
Bearish scenario: An hourly close below the hourly pivot at $0.03958 would weaken the recovery and expose the hourly Bollinger midpoint at $0.03951, followed by hourly S1 at $0.03935. A broader deterioration would bring the daily pivot at $0.03907 into focus, with daily S1 at $0.03678 below it. An hourly close above hourly R1 at $0.03998 would invalidate this local breakdown scenario.
The likeliest false signal is a brief break above hourly R1 that stalls at the daily EMA20. Their proximity, mixed momentum and the supplied ATR readings make a wick through resistance less convincing than a completed close. Neither local scenario alone would erase the neutral daily bias.
FAQ
Is $NIGHT’s daily trend bearish?
Not outright. The daily EMA order is bullish, but price remains below the daily EMA20. That leaves the current daily assessment neutral.
Does the 15-minute chart confirm a breakout?
No. Its bullish EMA structure is offset by falling RSI, despite a positive, widening MACD histogram. It provides execution context rather than confirmation of the daily recovery.
Disclaimer: This article is for informational purposes only and does not constitute financial advice, an investment recommendation, or a solicitation to buy or sell any financial instrument or cryptocurrency. The analysis provided is not indicative of future results. Investing in crypto assets and financial markets carries a high risk of capital loss. Always do your own research (DYOR) and consult a qualified financial advisor before making any decision.
Article produced with the assistance of artificial intelligence and reviewed by the editorial team.

 en.cryptonomist.ch