Analyst 360Trader predicts $XRP price will fall to $1 in the coming days, pointing to a liquidity zone beneath the cryptocurrency’s current trading range.
In a recent post on X, he described a move toward $1 as a buying opportunity. Accordingly, he said he plans to accumulate more tokens if the price reaches that level.
“See you around $1.00 where I will back the truck up,” 360Trader wrote.
Know when your coins move
Alerts, real-time prices, and market news — all in one app
Point your phone camera to install
4.8 based on 40K reviews in the App Store and Google Play
His latest warning builds on his previous analysis, which highlighted a fair value gap (FVG) below $XRP’s price and identified the $1.28 area as a key level to watch after the token lost its 50-day moving average.
$XRP Chart Points to $1.00 Liquidity Zone
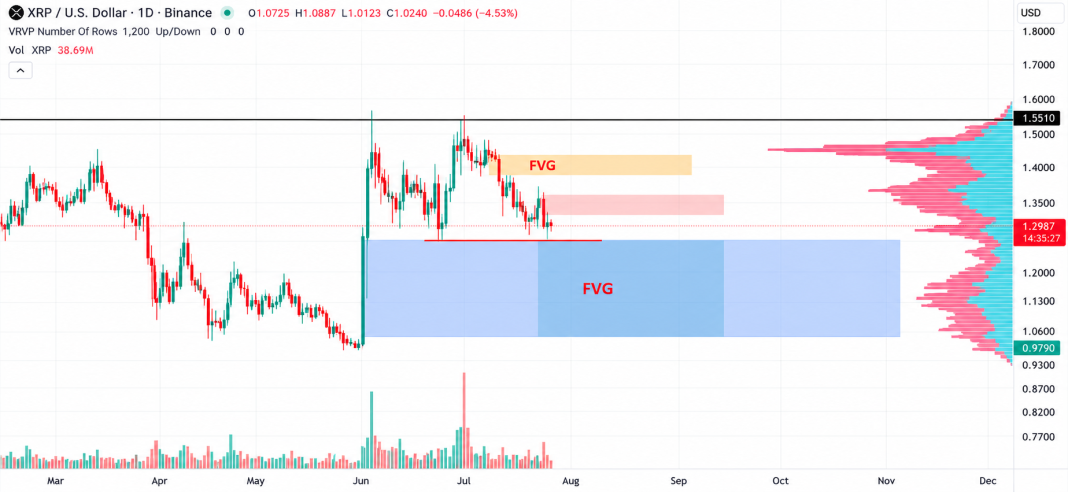
The daily chart shows a large blue-shaded fair value gap extending from approximately $1.00 to $1.25. This zone represents the area 360Trader expects to attract price action as $XRP weakens.
The analyst’s latest post identifies $1.248 as the level that unlocks a move toward $1.00. A break below this threshold exposes $XRP to the lower end of the highlighted zone, where the analyst plans to buy.
The chart also shows another fair value gap around $1.40–$1.48, above the current price. $XRP needs to reclaim this area to improve its short-term technical outlook.
Meanwhile, the volume profile on the right side of the chart shows concentrated trading activity around $1.35–$1.55, marking a key resistance zone for any recovery attempt.
$XRP USD Trading Chart with FVG Zones
Can $XRP Price Avoid a Drop Below $1.25?
As $XRP trades at $1.28, its ability to hold above $1.248 remains critical to its next move. According to 360Trader, a breakdown below this level would put $1.00 in focus as the next downside target.
The analyst previously warned that $XRP was trading at its 200-day moving average near $1.28 after losing its 50-day moving average. He also highlighted a liquidity level below the current price, pointing to further downside as the market seeks liquidity.
On the upside, a recovery through the 1.35–1.55 region identified by the volume profile would help $XRP regain lost ground and ease immediate selling pressure.
The view that $XRP could experience further price declines before its next major rally is becoming increasingly widespread within the community.
More Downside Before a Major Rally
Vandell Aljarrah, co-founder of Black Swan Capitalist, said in a post on X that $XRP could reach significantly higher valuations over the long term as rising global liquidity fuels demand for risk assets.
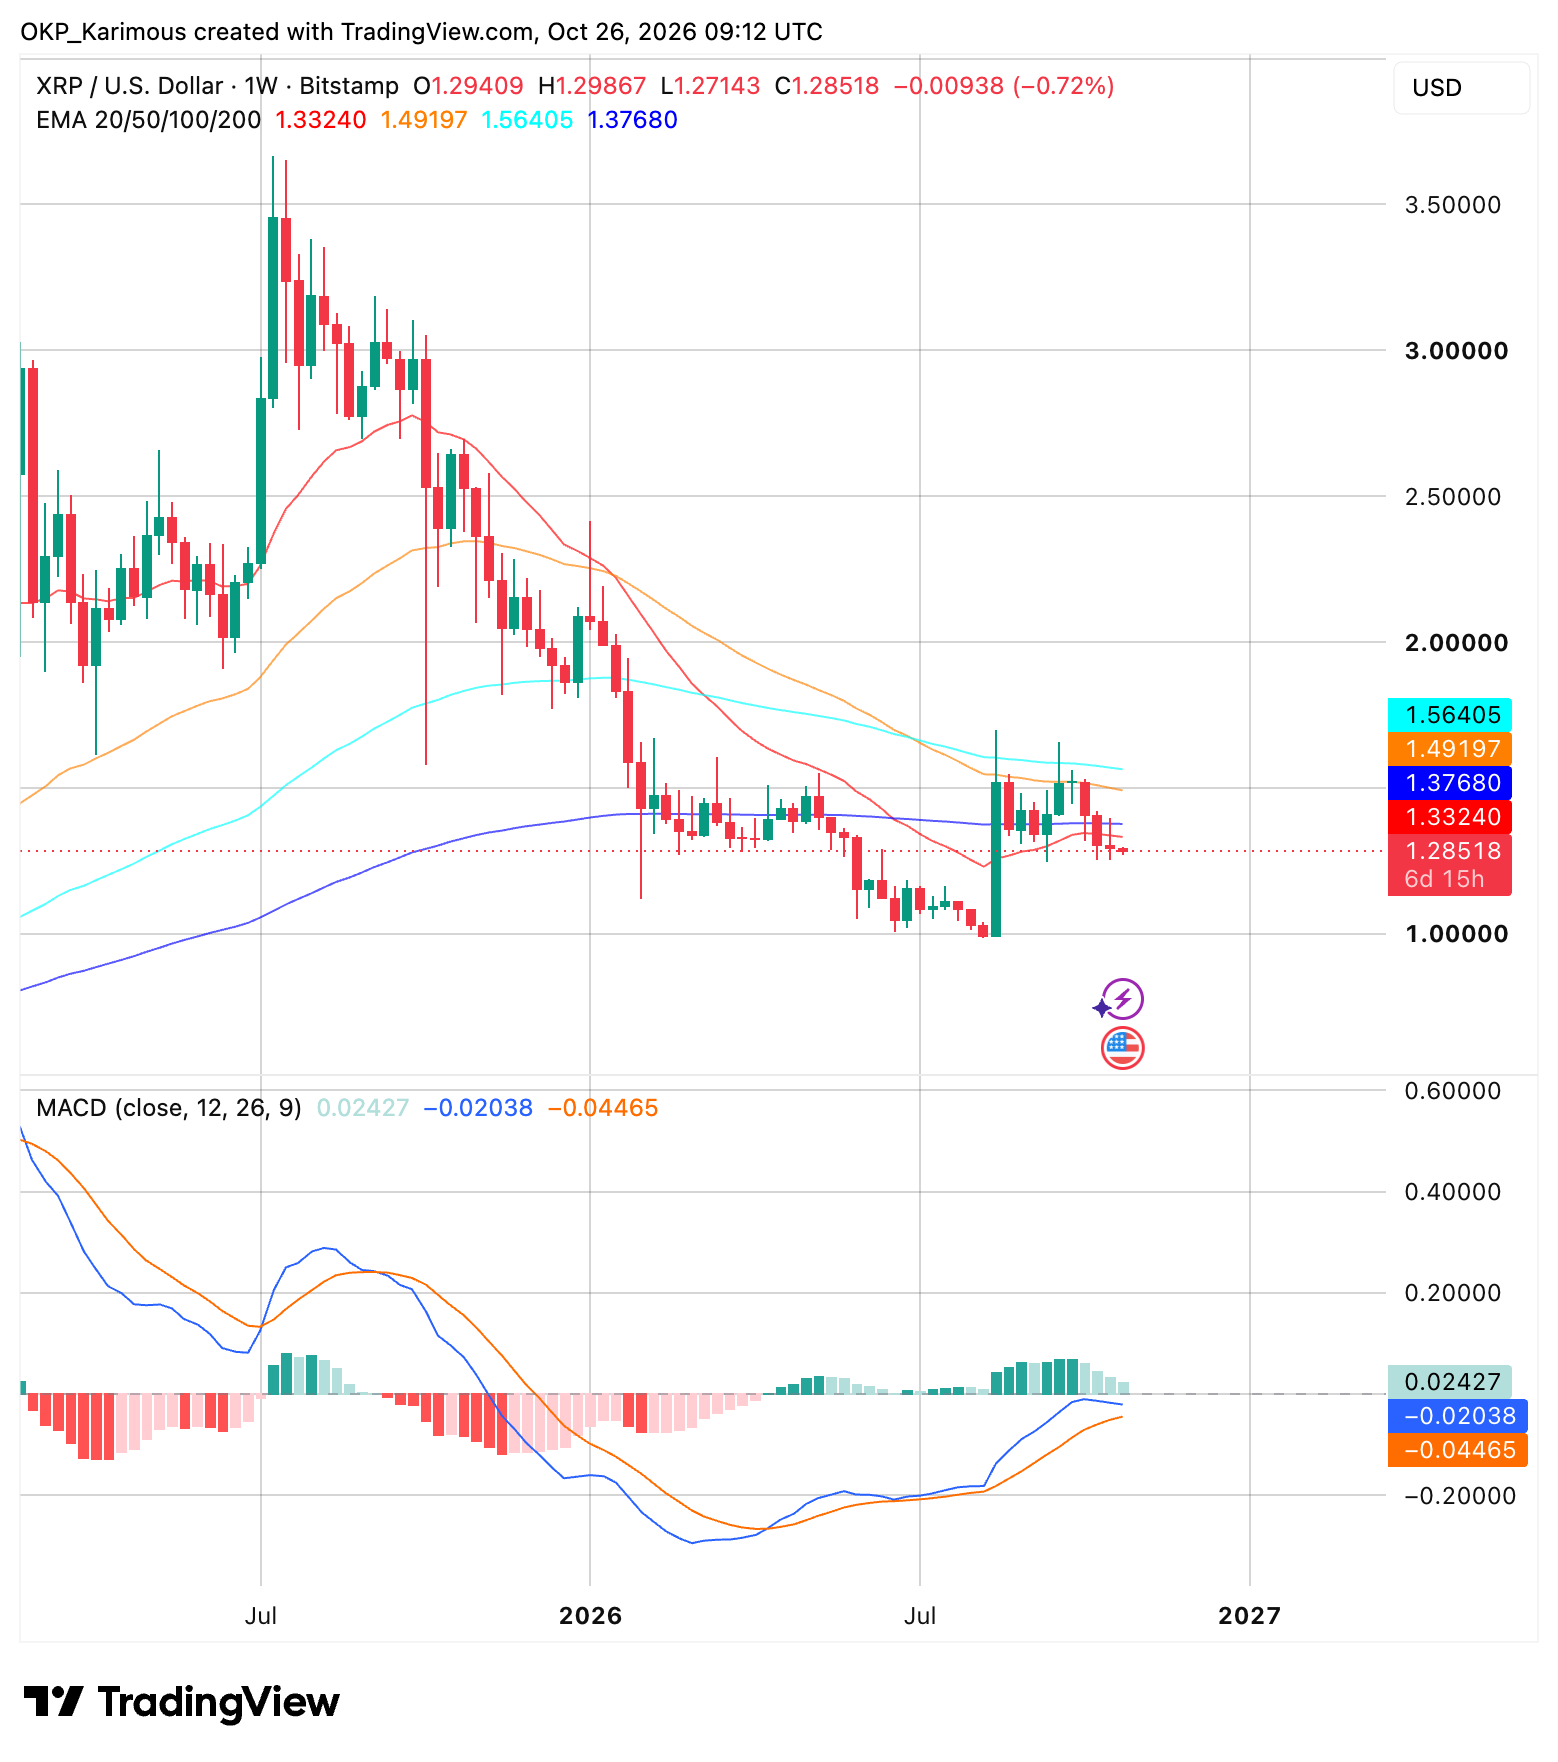
However, he noted that $XRP could face further declines before its next major rally. The weekly chart now shows $XRP trading below its 50-week and 200-week exponential moving averages (EMAs), at $1.56 and $1.37, respectively, increasing the risk of further dips.
BITSTAMP: $XRP/USD Weekly Chart Showing 50-EMA and 200-EMA
Aljarrah expects the next phase of the global debt cycle to trigger a significant expansion in liquidity to support crypto rally. He also pointed to $XRP’s consolidation before its 2017–2018 rally, arguing that prolonged sideways trading can precede major price gains.
In summary, $XRP remains in a corrective phase, with further downside possible before any sustained recovery. While Aljarrah maintains a bullish long-term outlook, a new uptrend has yet to be confirmed.

 thecryptobasic.com