Crypto Price Analysis, BTC, XRP, NEAR, SOL and ZEC, October 24: Bitcoin RSI Falls Below 46 as XRP Loses Daily Support
thecryptobasic.com
1 h
$NEAR leads declines as Bitcoin and $XRP momentum weakens. October 24 analysis tracks support, resistance and daily signals for $BTC, $XRP, $NEAR, $SOL and $ZEC.
Asset
USD price
24-hour change
Aggregate 24-hour volume
Market-cap rank
Bitcoin ($BTC)
$80,928
-1.02%
$22.34 billion
1
$XRP
$1.29
-2.13%
$1.25 billion
5
$NEAR Protocol ($NEAR)
$4.64
-6.23%
$608.09 million
20
Solana ($SOL)
$102.60
-1.45%
$2.19 billion
7
Zcash ($ZEC)
$1,173.07
-4.20%
$782.51 million
10
Bitcoin RSI Slips as Price Approaches October Support
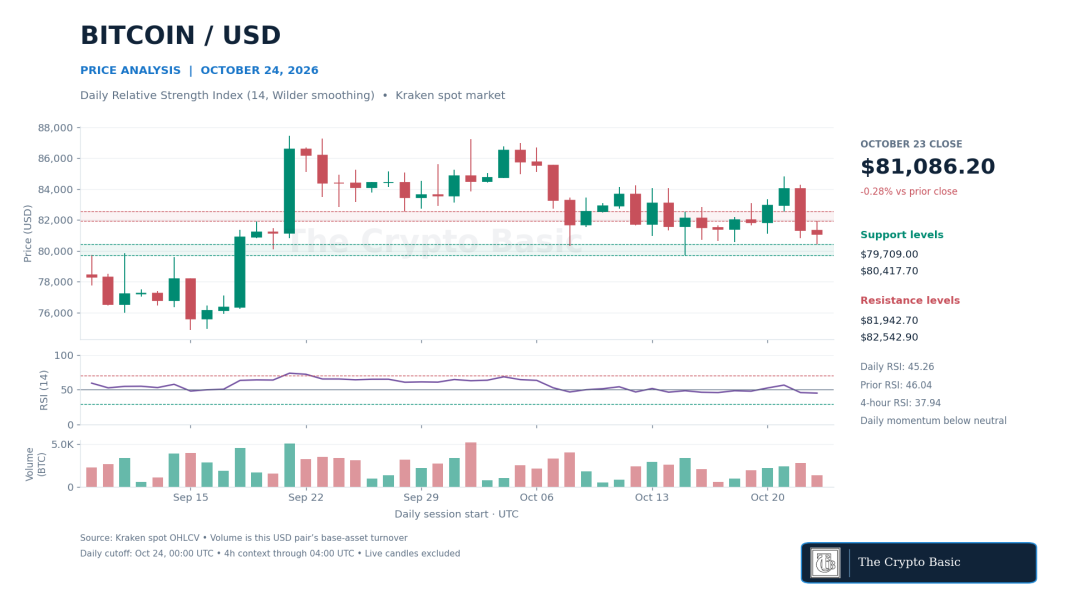
Bitcoin closed Friday at $81,086.20, down 0.28%, after trading between $80,417.70 and $81,942.70. That followed Thursday’s fall from $84,022.50 to $81,315.90. Friday’s lower high and lower low show that the rebound from the October 15 trough has lost momentum.
Know when your coins move
Alerts, real-time prices, and market news — all in one app
Point your phone camera to install
4.8 based on 40K reviews in the App Store and Google Play
$BTC/USD daily RSI slips to 45.26 as price closes at $81,086.20, with support at $80,417.70 and $79,709.
The 14-day Relative Strength Index, calculated with Wilder smoothing, slipped to 45.26 from 46.04. It has fallen back below the neutral 50 line after reaching 56.72 on Wednesday.
The reading indicates weaker momentum without reaching the conventional oversold threshold of 30.
The latest completed four-hour candle closed at $80,870.30, with RSI at 37.94. Short-term momentum was therefore weaker than the daily reading, and the early Saturday session had not recovered Friday’s closing price.
A daily close above $81,942.70 would recover Friday’s high and improve the approach to $82,542.90, the October 21 low. Clearing that level would strengthen a move toward $83,339.10 and the recent $84,840 high.
Conversely, a close below $80,417.70 would expose the October 15 low at $79,709. Losing that low would invalidate the rebound structure followed in this week’s reports.
$XRP Closes Below Support as Its MACD Gap Widens
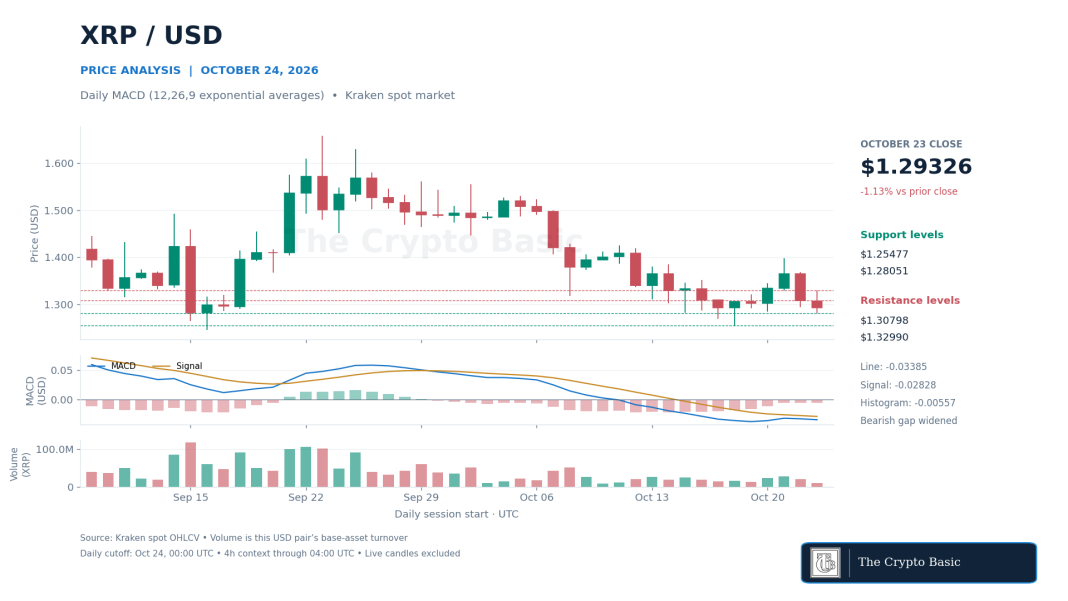
$XRP closed at $1.29326, down 1.13%, after reaching $1.32950 and falling to $1.28051. The close moved beneath the $1.29391 support highlighted in Friday’s report. The day’s high also stopped just short of former support at $1.32990, leaving that area unrecovered.
$XRP/USD daily MACD (12,26,9) remains bearish as the histogram widens to -0.00557 and price closes below $1.29391.
Daily MACD, using 12- and 26-period exponential moving averages with a nine-period signal EMA, remained bearish.
The line stood at -0.03385 against a -0.02828 signal. Its histogram widened slightly to -0.00557 from -0.00539, ending the previous session’s modest narrowing of the bearish gap. This is a change in momentum strength, not a new line-signal crossover.
The latest four-hour close was $1.28909. Four-hour MACD also remained below its signal, reinforcing the weak short-term picture. Friday’s closing price was 1.13% below the $1.30798 close discussed in the previous report.
A daily close above $1.30798 would begin repairing the latest decline. Reclaiming $1.32950–$1.32990 would provide stronger confirmation, with $1.36865 next.
A close below $1.28051 would expose the October 18 low at $1.25477. Losing that low would invalidate the current recovery base and bring $1.24610 into focus.
$NEAR Loses Its Shorter Trend Reference
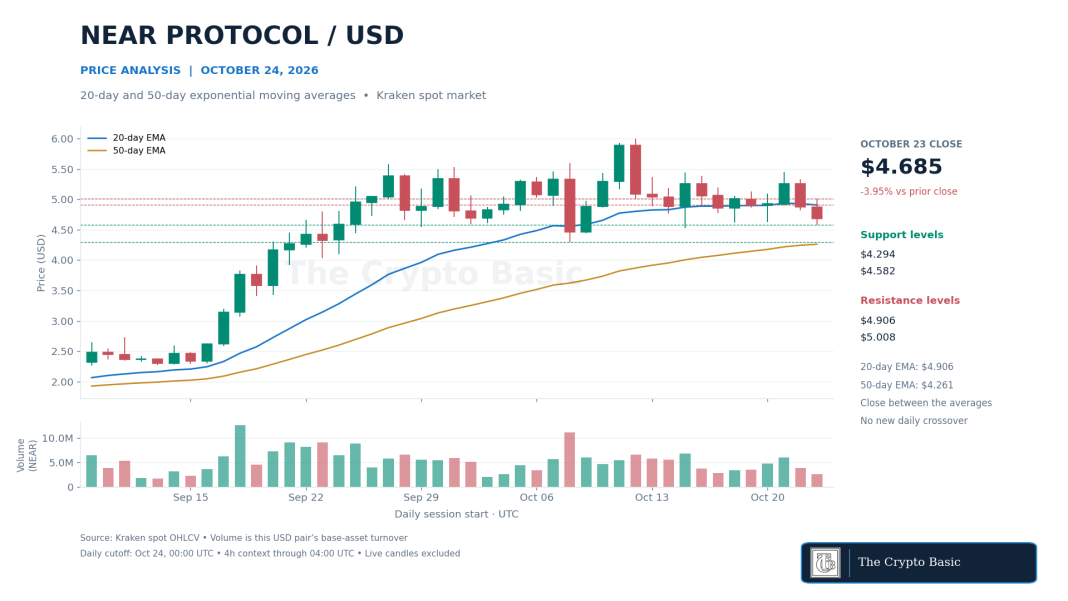
$NEAR closed Friday at $4.6848, down 3.95%, after a $4.5816–$5.0075 session. The candle extended Thursday’s decline and traded below the October 18 low at $4.6156, although it recovered above that level before the daily close. That distinguishes the intraday support break from a confirmed closing breakdown.
$NEAR/USD closes between its 20-day EMA at $4.9055 and 50-day EMA at $4.2611 after a 3.95% daily decline.
The 20-day exponential moving average declined to $4.9055 from $4.9288. Meanwhile, the 50-day EMA rose to $4.2611 from $4.2438. Price finished between the two, with the faster average still above the slower one.
There was no new daily bearish crossover; the immediate weakness is the loss of the 20-day trend reference.
Shorter-term conditions were also weak. The latest four-hour close at $4.6317 remained below both its 20-period EMA at $4.8999 and its 50-period EMA at $4.9664.
That candle reached $4.5491, extending below Friday’s low before recovering.
A daily close above $4.9055 and then $5.0075 would improve the recovery toward $5.3291–$5.4498. A daily close below $4.5491–$4.5816 would strengthen the breakdown toward the October 8 low at $4.2937 and the rising 50-day EMA.
Losing both would weaken the broader trend position. The moving-average levels will change with subsequent closes.
Solana Remains Below a Falling Bollinger Midpoint
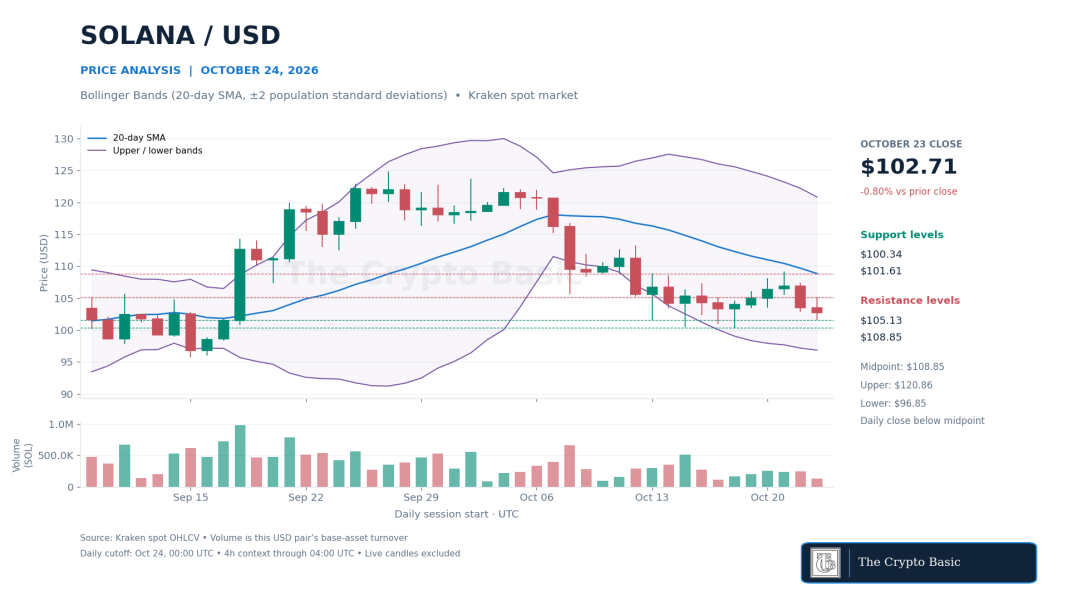
Solana closed at $102.71, down 0.80%, after trading as high as $105.13. Friday’s $101.61 low brought price back toward the October 17–18 support area at $101.00–$100.34. The decline followed a midweek recovery to $109.15 that has since failed to hold.
$SOL/USD remains below its falling $108.851 Bollinger midpoint, with the October base at $100.34 still intact.
Daily Bollinger Bands, calculated from a 20-day simple moving average and two population standard deviations, placed the midpoint at $108.851.
It fell from $109.6945 the previous day. The upper and lower bands stood at $120.8553 and $96.8467.
Price remains inside the envelope but below its falling midpoint. This describes a weak trend position rather than an oversold reversal signal.
The latest completed four-hour close at $102.55 was also below its four-hour midpoint at $105.0415.
A daily close above $105.13 would recover Friday’s high and improve the approach to $107.41. Clearing the daily midpoint near $108.85 and the October 21 high at $109.15 would offer stronger recovery confirmation.
A close below $101.61 would expose $101.00 and $100.34. Losing $100.34 would invalidate the recent base and put the lower-band reference near $96.85 in focus; that band is dynamic rather than fixed support.
Zcash Pullback Leaves Daily Ranges Elevated
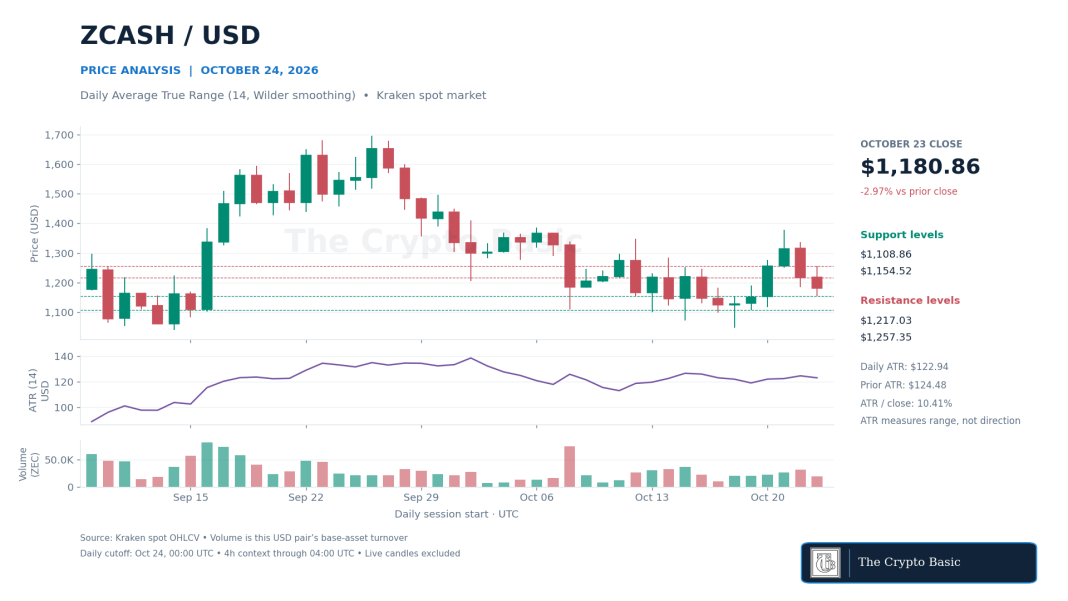
Zcash closed Friday at $1,180.86, falling 2.97% after a $1,154.52–$1,257.35 session. Its high and low were both below Thursday’s, extending the pullback from Wednesday’s $1,378.91 peak. The close also fell below Thursday’s $1,185.52 low.
$ZEC/USD daily ATR eases to $122.94, or 10.41% of price, as the pullback continues below $1,217.03.
The 14-day Average True Range, using Wilder smoothing, eased to $122.94 from $124.48. That still represents approximately 10.41% of the latest closing price, showing that recent daily ranges remain large relative to price. ATR measures volatility and does not establish whether the next move will be higher or lower.
The latest completed four-hour candle closed at $1,171.06, with four-hour ATR at $44.03. Price had not recovered Friday’s close, although it remained above the session low.
A daily close above $1,217.03 would recover Thursday’s closing level. Clearing $1,257.35 would strengthen the rebound toward $1,337.75 and $1,378.91.
A close below $1,154.52 would expose $1,117.08–$1,108.86. Losing the October 18 low at $1,047.63 would invalidate the broader rebound from that trough.

 thecryptobasic.com