XRP Risks Losing Weekly 200 EMA as Price Falls to $1.29
thecryptobasic.com
10 h
$XRP is showing weakness as its price slips below the weekly 200-day exponential moving average (EMA), a technical level that could signal the next move.
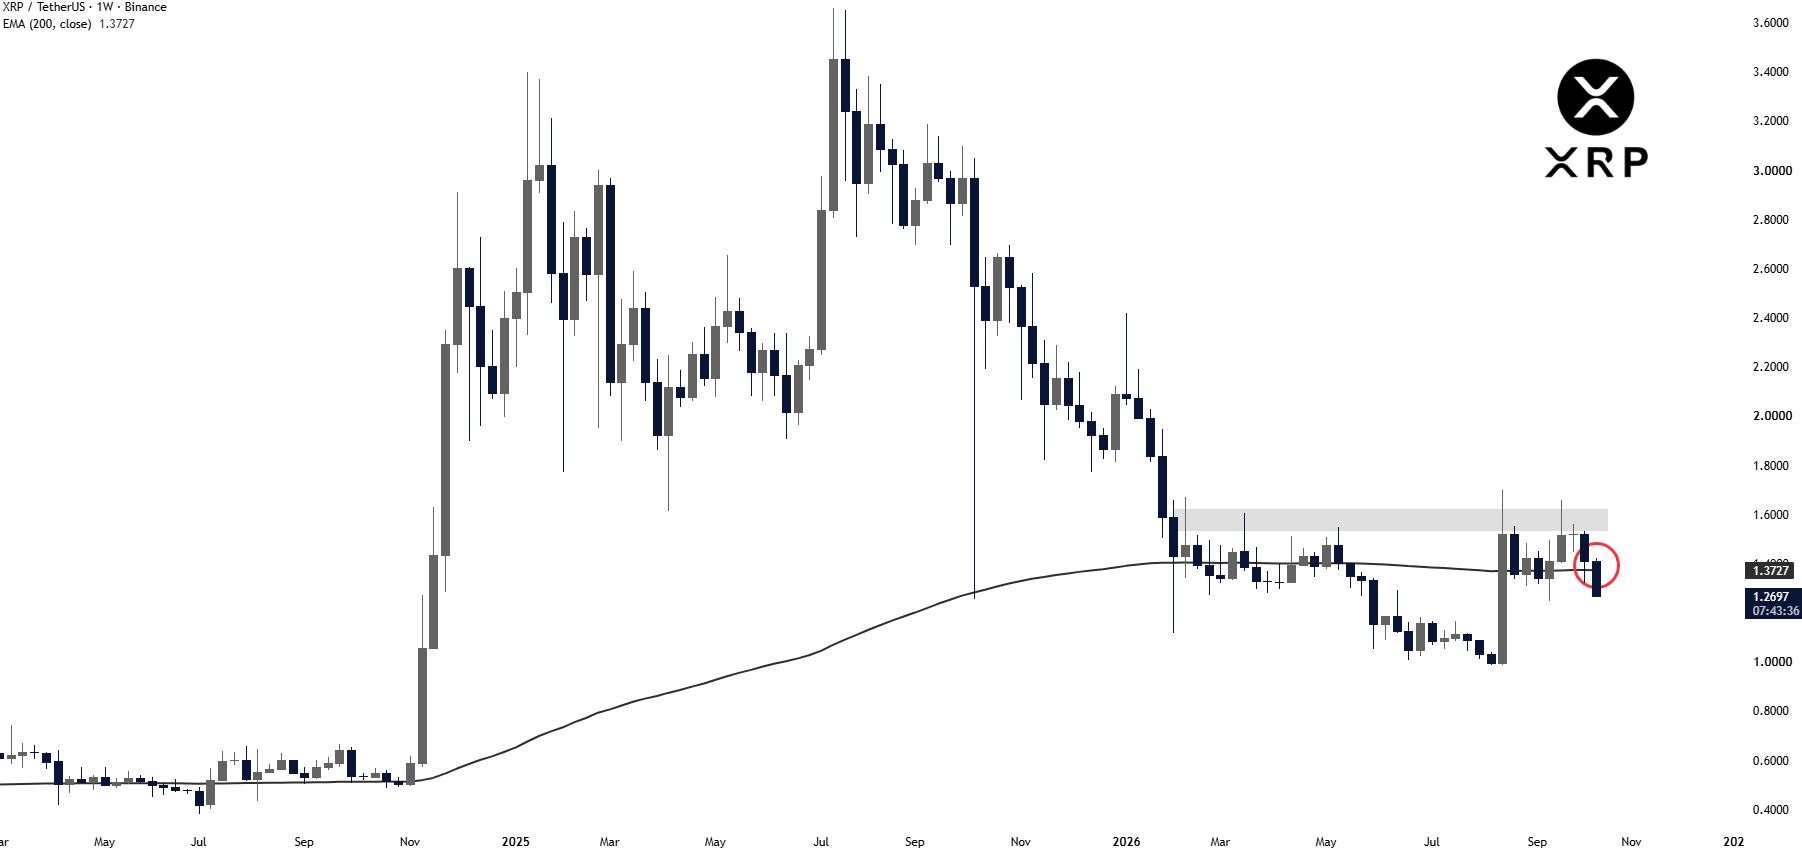
In a post on X, analyst Gerla warned that $XRP’s technical outlook was deteriorating as the latest weekly candle moved below the 200 EMA. The analyst highlighted the development as a concerning signal for the token.
“$XRP doesn’t look good here,” Gerla wrote, noting that the coin was sitting directly on the weekly 200 EMA before the latest decline.
Know when your coins move
Alerts, real-time prices, and market news — all in one app
Point your phone camera to install
4.8 based on 40K reviews in the App Store and Google Play
$XRP Tests Key Weekly Support
The weekly $XRP/USDT chart on Binance shows the token trading below its 200 EMA, which currently stands at approximately $1.377. $XRP is trading around $1.29, putting it roughly 6% below the indicator.
The chart shows that $XRP has struggled to recover since its decline from the $3.60 area in July 2025. After falling below $1.00 in August 2026, the token rebounded sharply but hit resistance around the$1.60 zone.
That resistance area, highlighted by the gray rectangle on the chart, has capped recent recovery attempts. $XRP’s latest pullback has now pushed it below the weekly 200 EMA, raising concerns about whether the token can reclaim the level.
A continuous move below the indicator could reinforce the bearish outlook, while a recovery above $1.37 would put $XRP back above this key technical benchmark.
Price Drops 7% in a Week
CoinMarketCap data shows $XRP trading at $1.29, down approximately 7% over the past seven days and 9% over the past month.
The decline reflects continued pressure on the asset as it struggles to regain higher price levels. The $1.00 area remains a notable reference point on the weekly chart, given that $XRP recently rebounded from that region.
$XRP Weekly Chart Showing Price Drop under 200-EMA
$XRP May Be Nearing a Long-Term Bottom
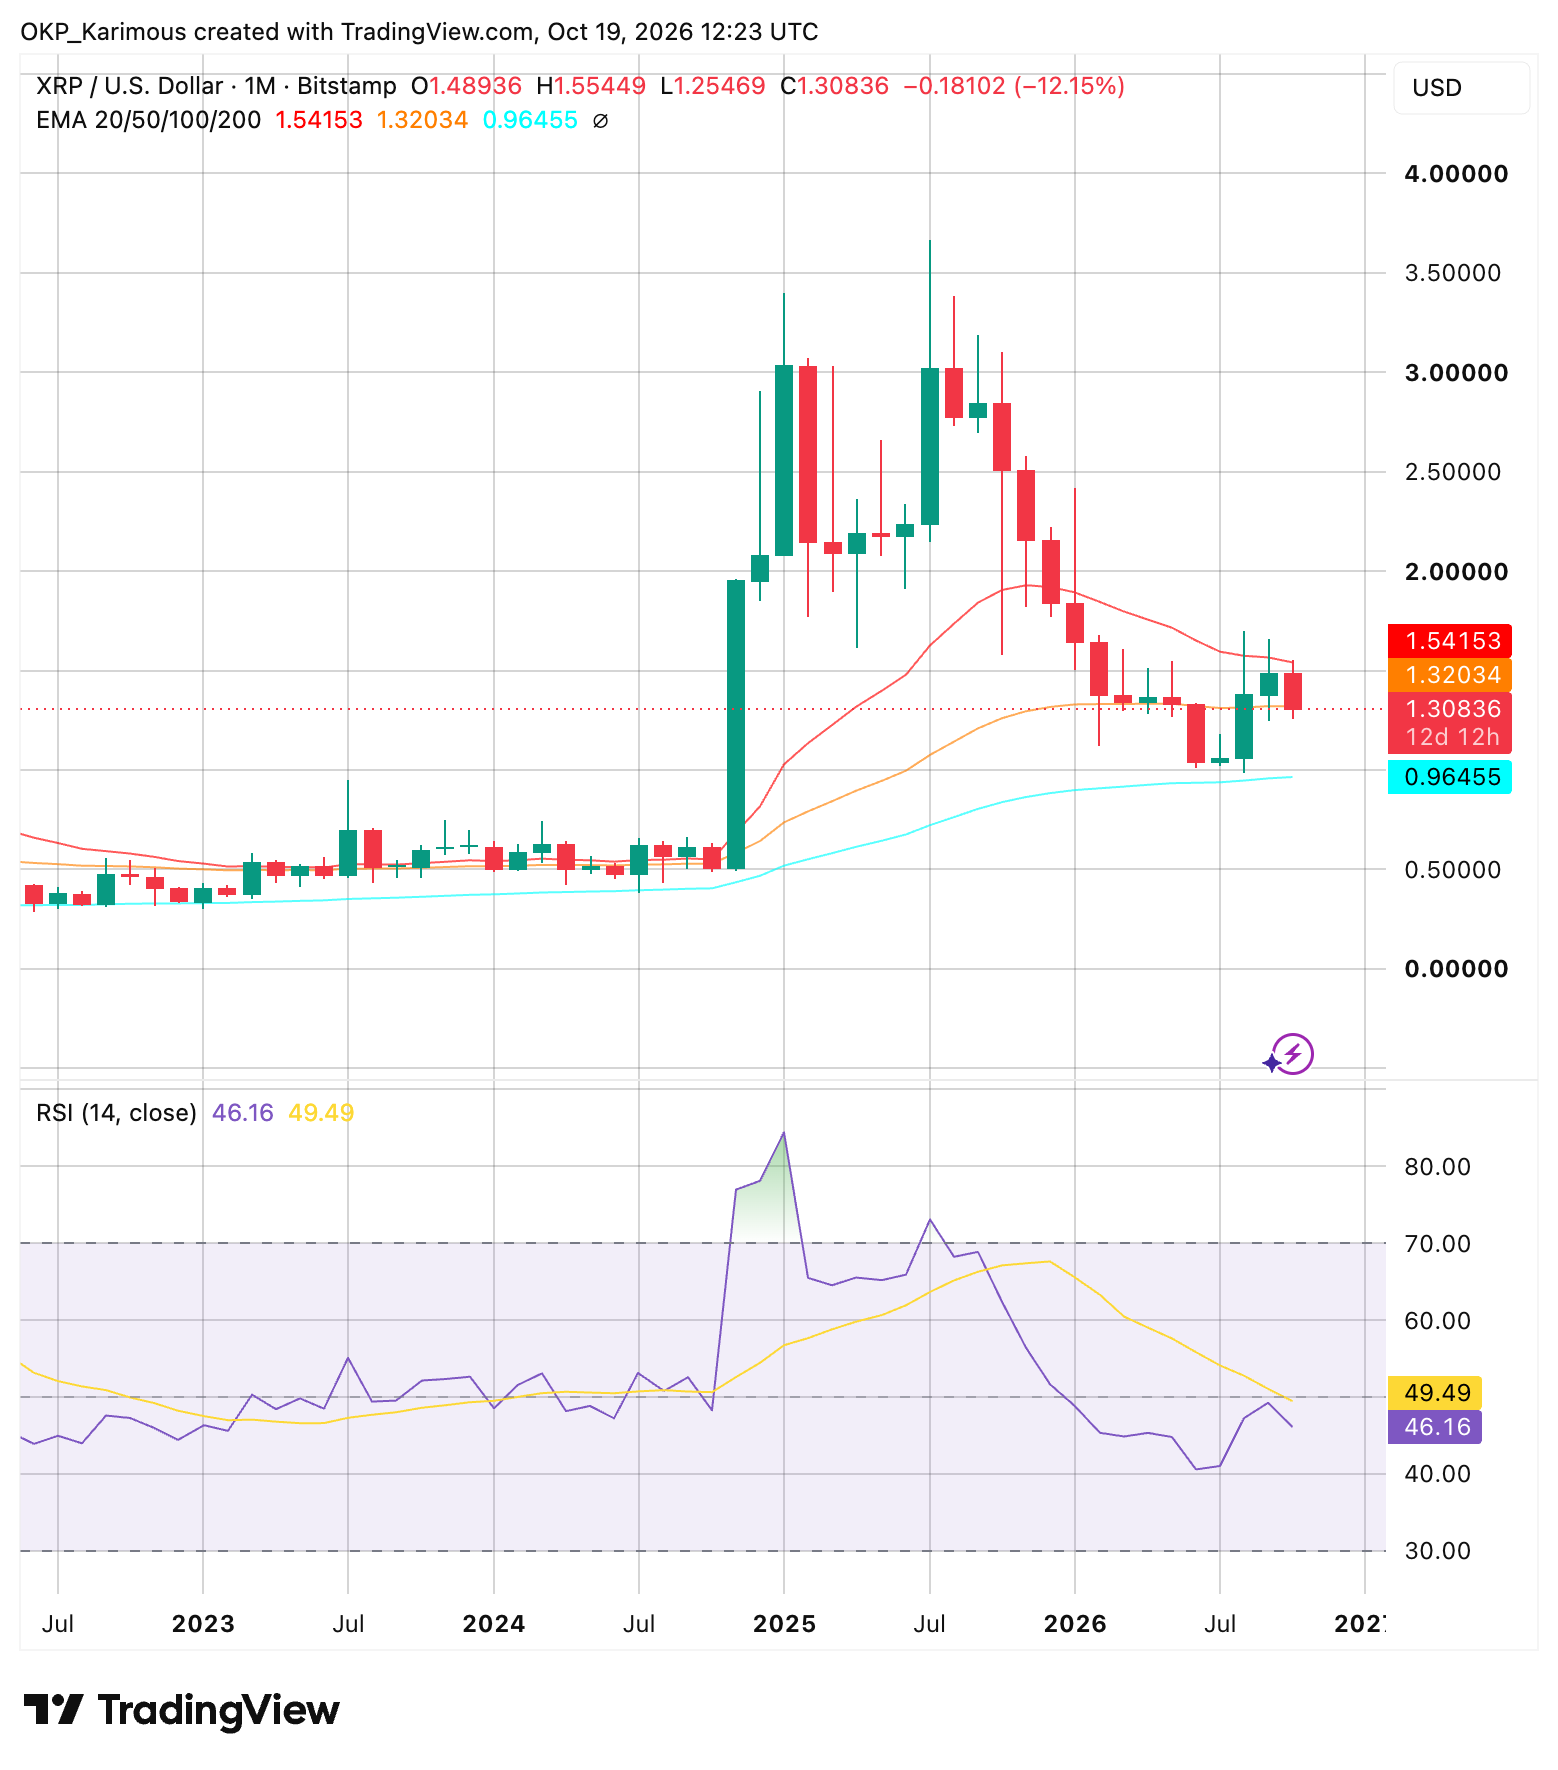
Despite the recent price weakness, historical patterns suggest $XRP is approaching the bottom of its current bear cycle. In 2022, the token fell below its monthly 50-period and 100-period moving averages before reaching a low of $0.29.
In 2026, $XRP has dropped below the monthly 50-period moving average but remains above the 100-period average, currently near $0.84. Essentially, $XRP could still revisit $1.00 or fall further toward $0.84 before establishing a lasting bottom.
Meanwhile, its monthly Relative Strength Index (RSI) stands at 46.16, slightly below its average of 49.49. Previous market cycles suggest similar readings can appear near long-term buying opportunities.
However, $XRP needs to regain key resistance levels to confirm a recovery. A move above its weekly 50-period moving average, currently around $1.49, would signal improving buying pressure. Until then, the risk of further declines remains, despite signs that the broader bear cycle may be nearing its end.

 thecryptobasic.com