Crypto Price Analysis, BTC, ETH, SOL, AERO and ONDO, October 20: Bitcoin Holds Near $82,000 as Solana, Aerodrome and Ondo Post Modest Gains
thecryptobasic.com
10 h
Bitcoin holds near $82,000 as Ethereum lags and Solana, Aerodrome and Ondo edge higher. October 20 analysis tracks key support, resistance, and daily signals.
Asset
Aggregate USD price
Rolling 24-hour change
Aggregate 24-hour volume
Bitcoin ($BTC)
$82,013
−0.48%
$25.37 billion
Ethereum ($ETH)
$2,410.99
−0.43%
$9.21 billion
Solana ($SOL)
$105.17
+0.08%
$2.56 billion
Aerodrome Finance ($AERO)
$0.808417
+1.20%
$44.09 million
Ondo (ONDO)
$0.441386
+1.58%
$100.25 million
Bitcoin’s MACD Improves Without a Bullish Crossover
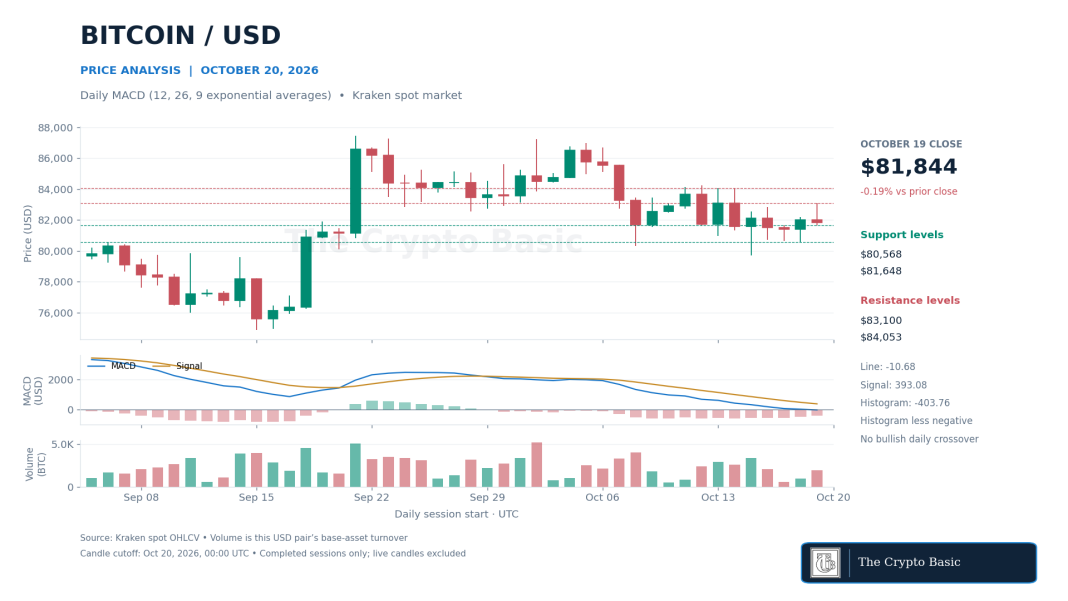
Bitcoin closed October 19 at $81,843.70, down 0.19%, after reaching $83,100. The session traded above the $82,538–$82,826 resistance area identified in Monday’s report but failed to hold above it at the close. That was an intraday move through resistance, not a confirmed daily breakout.
Know when your coins move
Alerts, real-time prices, and market news — all in one app
Point your phone camera to install
4.8 based on 40K reviews in the App Store and Google Play
$BTC/USD daily MACD (12,26,9) remains below its signal despite a less-negative histogram, while the latest session fails to close above $83,100.
Daily MACD, using 12- and 26-period exponential averages with a nine-period signal EMA, remained bearish. Its line fell to −10.68 against a 393.08 signal.
The histogram improved to −403.76 from −456.84, indicating a narrowing gap between the lines rather than a bullish crossover. The MACD line also crossed below zero on the completed candle.
The latest completed four-hour histogram was positive at 73.83, showing stronger short-term momentum than the daily reading.
CoinGecko’s quote was nevertheless 0.50% below Monday’s $82,428 report snapshot, a separate comparison from its rolling 24-hour change.
A daily close above $83,100 would strengthen a recovery toward $84,049–$84,250, the cluster of October 12–14 highs.
Losing $81,648 on a daily close would weaken the latest rebound and expose $80,568. A close below the October 15 low at $79,709 would invalidate that recovery structure.
Ethereum’s RSI Remains Below Neutral
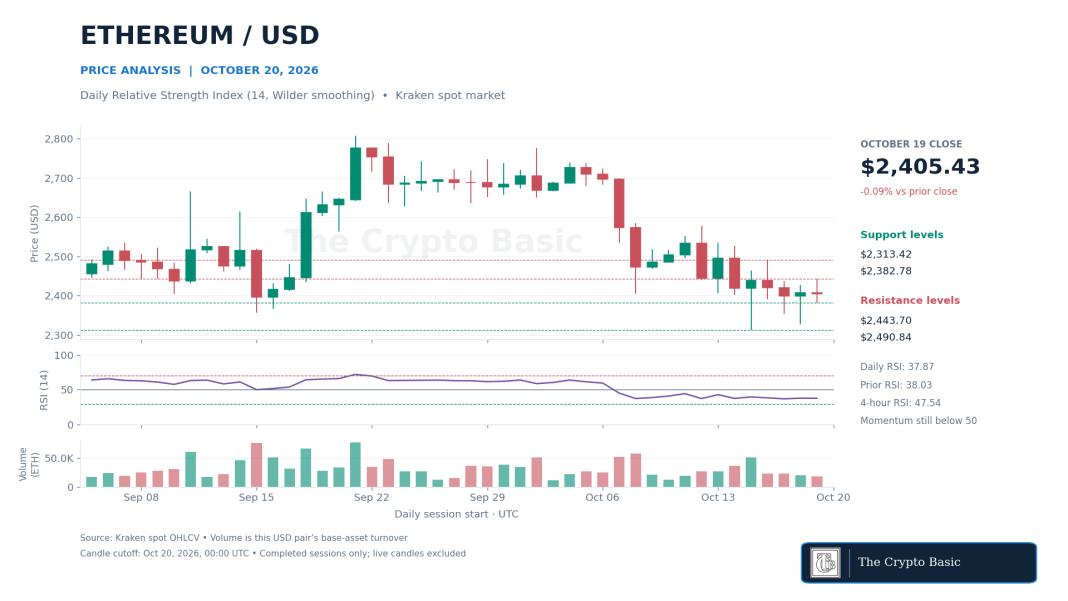
Ethereum closed at $2,405.43, slipping 0.09% after a $2,382.78–$2,443.70 session. The daily chart remains below the October 16 high at $2,490.84 and the earlier $2,527–$2,535 resistance area, leaving the broader October pullback intact.
$ETH/USD daily RSI (14, Wilder) holds at 37.87 as Ethereum trades below $2,443.70 resistance and above the October 15 low at $2,313.42.
The 14-day RSI, calculated with Wilder smoothing, eased to 37.87 from 38.03. It remained below the neutral 50 line without reaching the conventional 30 oversold threshold.
This points to weak momentum, not a standalone signal that a rebound is due. Four-hour RSI was firmer at 47.54 but also below neutral.
Ethereum’s aggregate quote was 0.60% below the $2,425.66 snapshot in the October 17 edition.
The earlier downside reference at $2,313.42 remains intact, although subsequent sessions have not produced a sustained recovery.
A daily close above $2,443.70 would improve the immediate structure and bring $2,490.84 into focus. Clearing that second level would strengthen the case for a test of $2,527–$2,535.
Conversely, a close below $2,382.78 would expose $2,354.01 and $2,326.25. Losing $2,313.42 on a daily close would invalidate the developing base.
Solana Rebounds Beneath Two Falling Averages
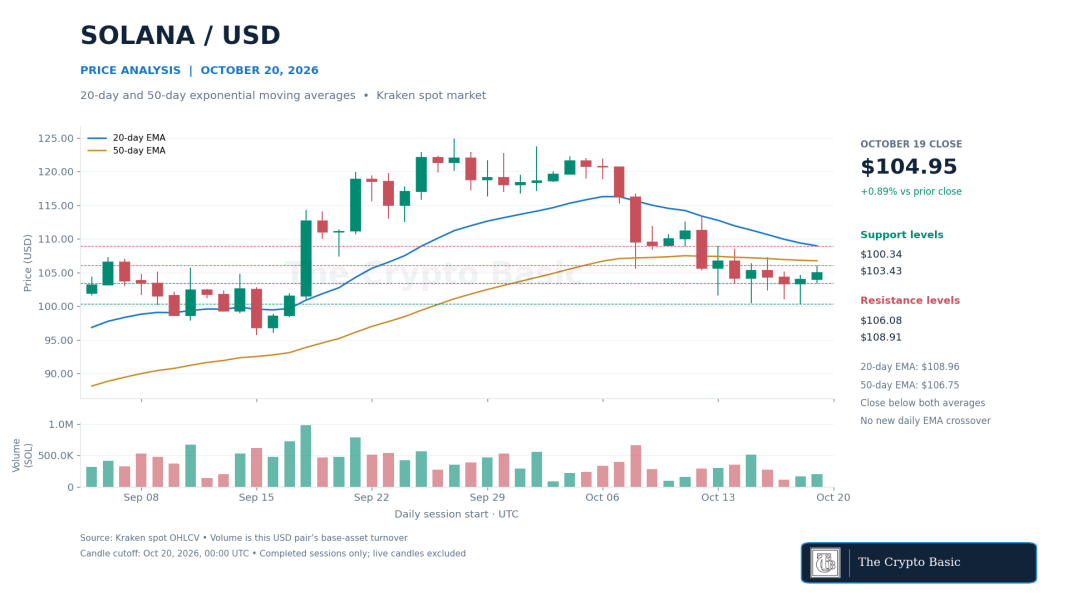
Solana gained 0.89% on its completed daily candle to close at $104.95. That extended the recovery from Sunday’s $100.34 low, but the close remained below the 50-day exponential moving average at $106.75 and the 20-day EMA at $108.96.
$SOL/USD daily candles recover from $100.34 but remain below declining 20-day and 50-day EMAs at $108.96 and $106.75.
Both averages declined from the previous session. The faster 20-day average remained above the 50-day average, so the chart did not produce a new bearish crossover.
The relevant signal is simpler: price remains beneath two falling trend references.
Four-hour price action was less weak. The latest completed close stood above its 20-period EMA at $104.28 but below the 50-period EMA at $106.01.
This supports a short-term rebound interpretation without overturning the daily trend.
A daily close above Monday’s $106.08 high would put the 50-day EMA in reach. A subsequent close above $108.91–$108.96, where the October 13 high meets the 20-day EMA, would materially improve the recovery toward $111.92–$113.27.
Failure to hold $103.43 would weaken that scenario and bring $101.00 into view. A daily close below $100.34 would invalidate the latest rebound.
Aerodrome Loses Support Despite Its 24-Hour Gain
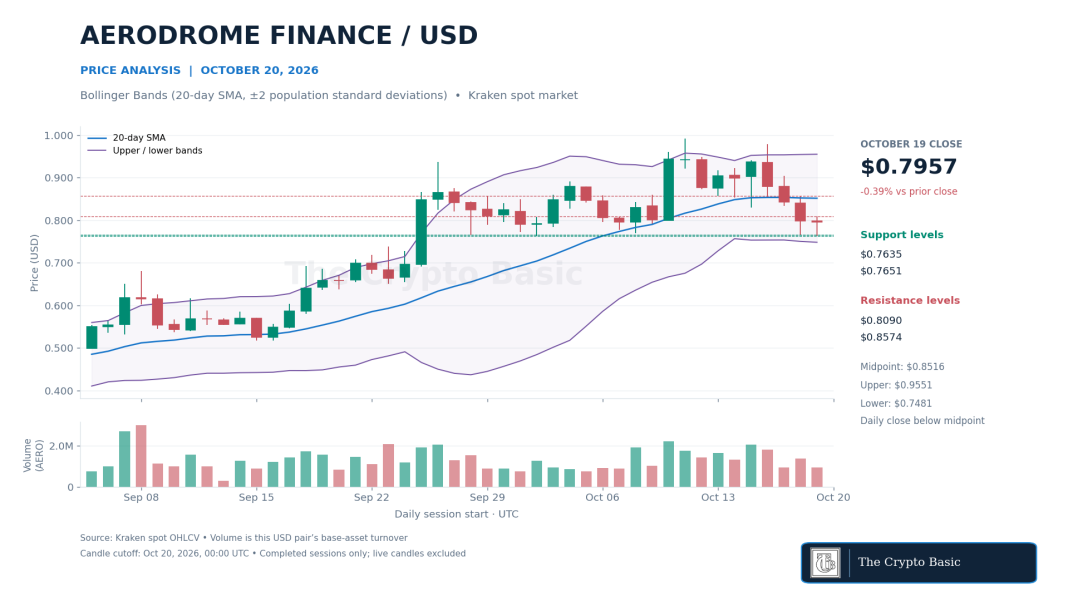
Aerodrome’s positive rolling return contrasts with a weaker completed daily chart. It closed October 19 at $0.7957, down 0.39%, following Sunday’s close below $0.8300. The October 16 report had identified that level as the invalidation point for the earlier recovery.
$AERO Price Analysis 2026 10 20
The latest aggregate quote was 12.08% below that report’s $0.919539 snapshot. This is a multi-day comparison, not the coin’s current 24-hour performance.
Daily Bollinger Bands, using a 20-day simple moving average and two population standard deviations, placed the midpoint at $0.8516 and the lower band at $0.7481.
Price remained below the midpoint but inside the bands. The reading shows a weakened recovery, not an automatic buy signal near the lower band.
Monday’s $0.7636 low nearly matched the October 2 low at $0.7635, establishing a visible support test.
A daily close above $0.8090 would be an initial improvement; reclaiming $0.8516–$0.8574 would recover the band midpoint and Sunday’s high, strengthening a move toward $0.9045.
A close below $0.7635 would invalidate the support hold and expose the lower-band reference near $0.7481, which will change with subsequent closes.
Ondo Tests the First Retracement of Its Latest Decline
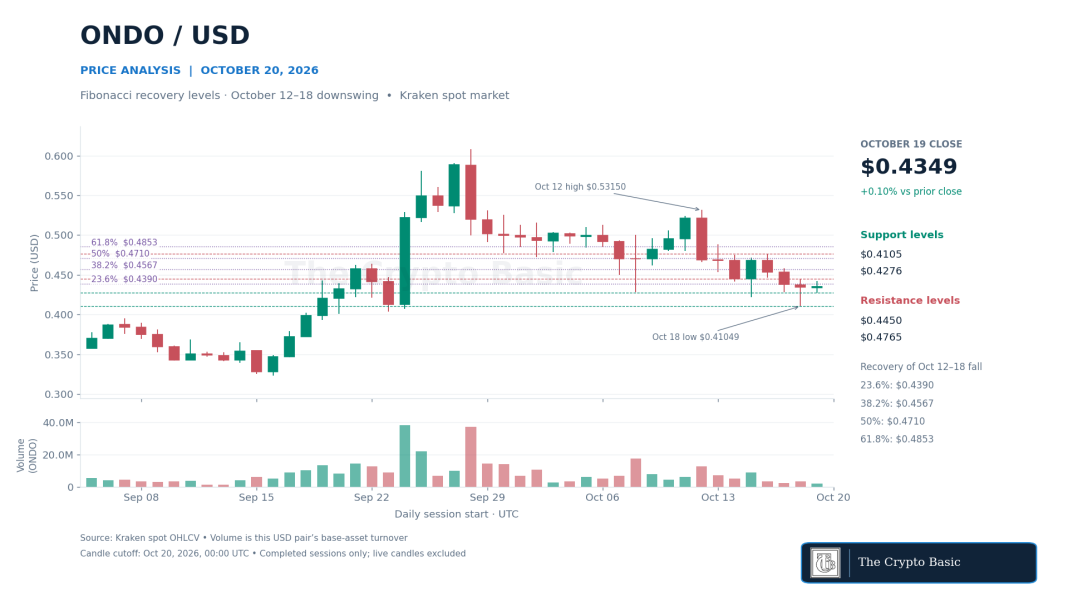
Ondo closed at $0.43493, up 0.10%, after recovering from Sunday’s $0.41049 low. The rebound remained small relative to the decline from the October 12 swing high at $0.53150.
$AERO/USD daily Bollinger Bands show price below the $0.8516 midpoint after losing $0.8300 support, with repeated lows near $0.7635.
Fibonacci levels measure an upward retracement of that specific October 12–18 downswing.
The 23.6% level is $0.43905, 38.2% is $0.45672, the 50% midpoint is $0.47100 and 61.8% is $0.48527. Monday’s completed close remained below the first level.
The live October 20 Kraken candle subsequently reached $0.44373 and last traded at $0.44139 in the captured response.
That put price above 23.6% intraday, but it did not confirm a daily close above the retracement.
A daily close above $0.44496, Sunday’s high, would strengthen the rebound toward $0.45672.
Clearing that level would improve the approach to $0.47100 and the October 16 high at $0.47649. A daily close below $0.42764 would weaken the immediate recovery, with $0.42200 and $0.41049 next.
A new low below $0.41049 would invalidate these retracement anchors and require recalculation.

 thecryptobasic.com