The tension matters because daily downside momentum is easing, but shorter timeframes are not delivering a clean continuation signal. Solana has room to recover without changing the broader picture; reclaiming nearby resistance would be progress, not proof that the daily weakness is over.
Network activity offers context, not confirmation of a breakout
Ecosystem and on-chain data provide background on Solana’s network health but do not confirm a price breakout. Ledger unveiled its Atom Android device with Solana Mobile integration. That product development offers ecosystem context, yet it does not establish a price catalyst or resolve the technical resistance overhead.
CoinGecko puts total cryptocurrency market capitalization at $2.76 trillion, down 2.04% over 24 hours, with Bitcoin dominance at 60.20%. The broader backdrop therefore leans defensive.
Chain-level data show $1.57 billion in 24-hour DEX trading volume across the Solana blockchain. Venue performance is mixed: PumpSwap volume rose 140.25% over one day and Orca DEX rose 33.29%, while HumidiFi and BisonFi recorded no daily change. Over seven days, Raydium AMM fell 11.01% and HumidiFi fell 77.44%. These are chain-wide trading volumes, not $SOL-specific turnover, fees or revenue; they do not demonstrate uniform demand for the asset.
Solana price recovery remains below the daily repair zone
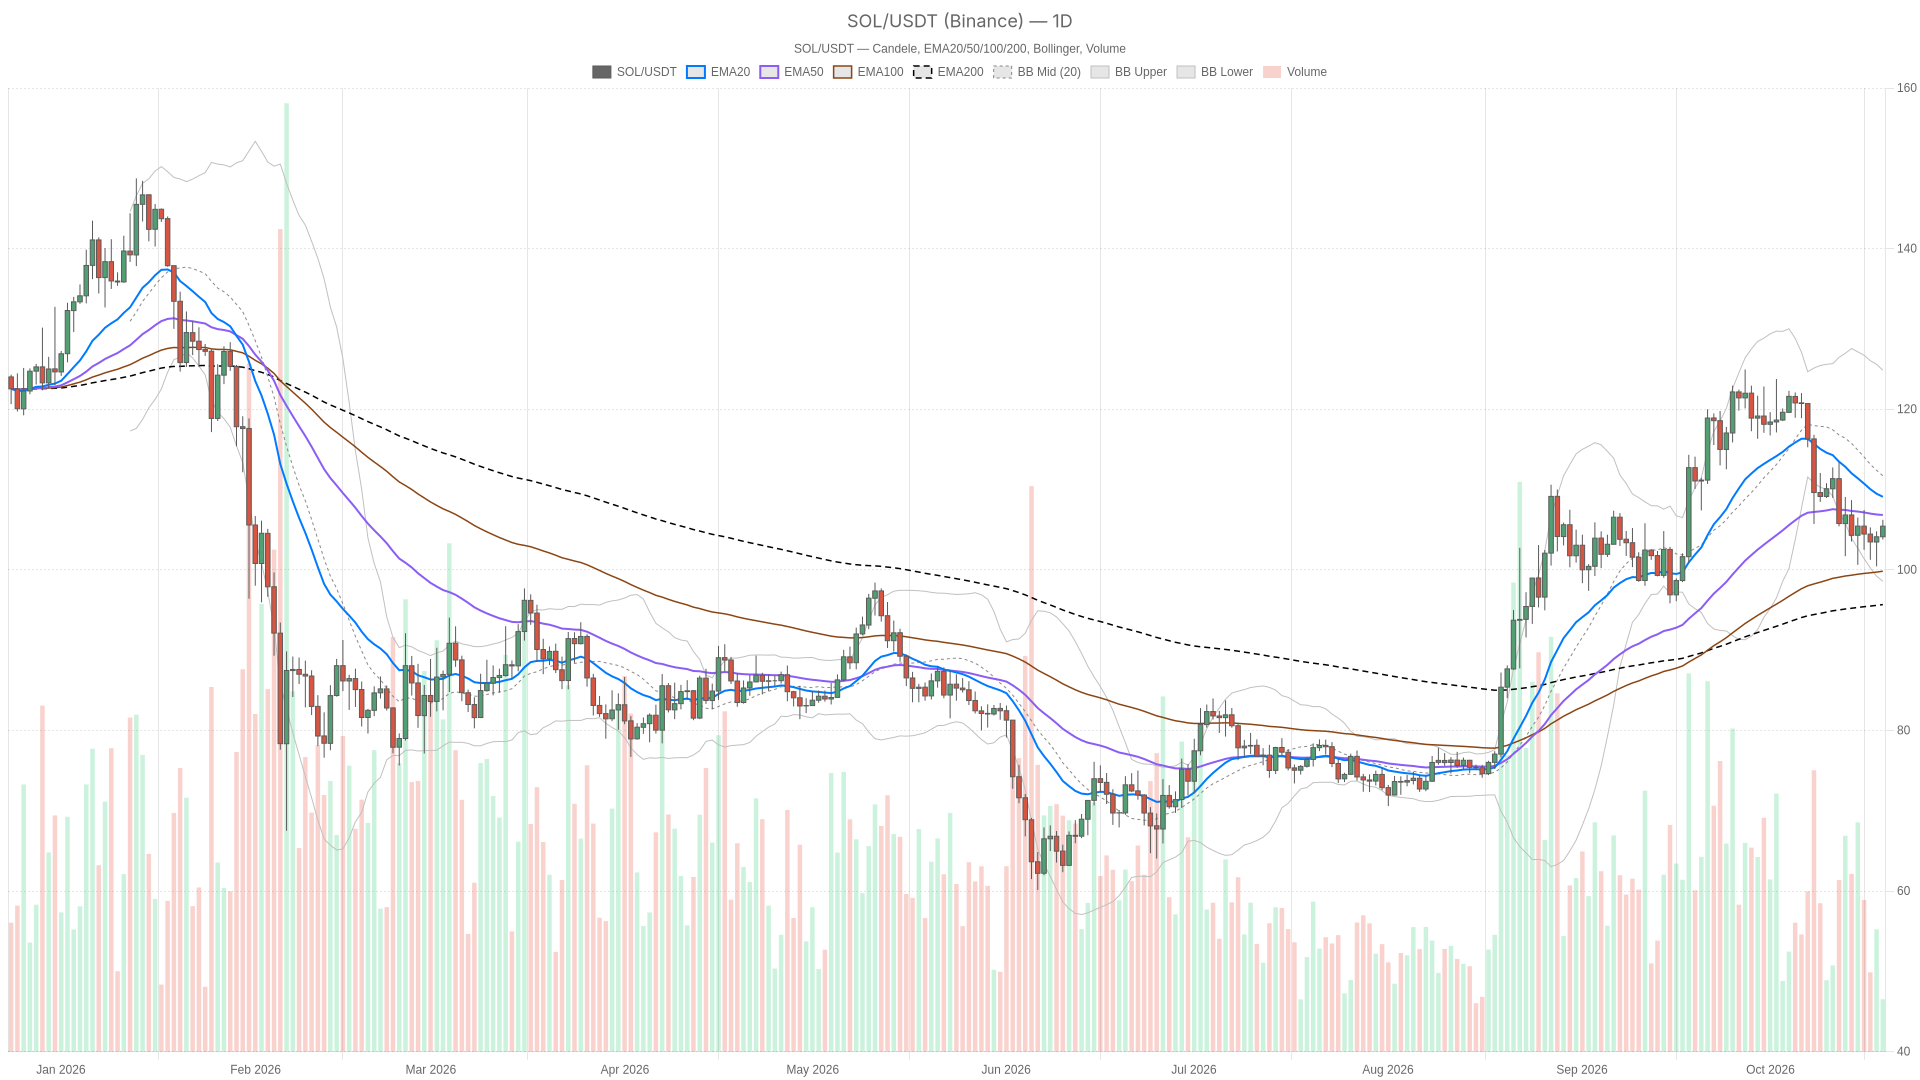
Solana’s bounce has not yet reached the levels required to repair its daily trend structure. Binance candle data show price below the daily EMA20 at $109.47 and daily EMA50 at $106.89, but above the daily EMA200 at $95.57. The averages retain a bullish ordering, yet price is beneath the two faster measures. That combination supports a neutral macro bias rather than either a clean uptrend or a fully bearish long-term structure.
The hourly chart offers a partial counterweight. Price is above the hourly EMA20 at $104.54 and hourly EMA50 at $104.17, but below the hourly EMA200 at $106.43. Those averages are not aligned. The rebound has established short-term strength without clearing the longer hourly barrier.
For execution context only, the 15-minute price is at $105.44, below its EMA20 at $105.60 but above its EMA50 at $104.96 and EMA200 at $104.21. Despite the bullish ordering of those averages, the loss of the fastest average leaves the immediate advance vulnerable. This shorter timeframe weakens the recovery case; it does not overturn the daily assessment.
Easing daily selling pressure meets fading hourly momentum
Daily RSI is 38.8, below neutral but not oversold. The daily MACD histogram remains negative, although its negative magnitude is narrowing across the last three completed readings. Selling momentum is easing, but there is no positive daily momentum confirmation.
Hourly RSI has fallen to 62.0, while the positive MACD histogram is narrowing. Momentum still favors the rebound, but its strength is fading. On the 15-minute chart, RSI has fallen to 50.1 and the negative MACD histogram is widening. The disagreement is explicit: daily pressure is moderating just as shorter-term upside momentum deteriorates.
The daily Bollinger midpoint at $112.39 remains well above price, with the lower band at $99.20 and upper band at $125.59. Solana occupies the lower half of that envelope, reinforcing the distinction between a rebound and a broader recovery. Meanwhile, the hourly upper band at $107.28 offers a nearer measure of upside extension, not a guarantee that price will reach it.
Daily ATR is $5.03, compared with hourly ATR of $0.7715 and 15-minute ATR of $0.3113. Consequently, these readings put the tightly spaced nearby pivot levels in perspective: a brief crossing can occur within ordinary price movement and should not automatically be treated as structural confirmation.
The hourly pivot separates recovery from renewed weakness
The nearest resistance is the hourly pivot at $105.63, followed by daily R1 at $105.79 and hourly R1 at $105.81. These are distinct levels despite their proximity. Below price, hourly S1 at $105.29 is the first support; the daily pivot at $103.11 is the broader daily reference. The last completed hourly candle closed at $105.47, leaving both directional triggers below unconfirmed.
Bullish scenario: an hourly close above $105.63
An hourly close above the hourly pivot at $105.63 would activate the recovery scenario, bringing daily R1 at $105.79 and hourly R1 at $105.81 into focus. Clearing that resistance area would leave the hourly EMA200 at $106.43 as the next structural obstacle. This scenario would be invalidated by an hourly close below hourly S1 at $105.29.
Bearish scenario: an hourly close below $105.29
An hourly close below hourly S1 at $105.29 would favor renewed weakness toward the hourly EMA20 at $104.54 and hourly EMA50 at $104.17. The daily pivot at $103.11 would become the deeper reference if that hourly support structure failed. An hourly close back above the hourly pivot at $105.63 would invalidate this bearish setup.
The likeliest false signal is a brief push above the hourly pivot that fails around the closely spaced daily and hourly R1 levels. Fading hourly momentum makes that risk credible, while easing daily downside momentum also limits confidence in an immediate bearish extension. Solana needs completed-candle confirmation rather than an isolated intrabar break.
FAQ
Is Solana oversold?
No. Daily RSI is 38.8, hourly RSI is 62.0 and 15-minute RSI is 50.1; none is below 30.
Do the DEX figures measure $SOL trading alone?
No. They measure DEX trading volume across the Solana blockchain, not $SOL-specific turnover, fees or revenue.
What is the key level to watch for Solana?
The hourly pivot at $105.63 is the immediate trigger. A close above it would activate a recovery scenario, while a close below hourly S1 at $105.29 would renew bearish pressure.
Is the daily trend bearish?
Not fully. Daily EMAs retain bullish ordering, but price sits below the two faster averages, creating a neutral macro bias rather than a confirmed downtrend.
Disclaimer: This article is for informational purposes only and does not constitute financial advice, an investment recommendation, or a solicitation to buy or sell any financial instrument or cryptocurrency. The analysis provided is not indicative of future results. Investing in crypto assets and financial markets carries a high risk of capital loss. Always do your own research (DYOR) and consult a qualified financial advisor before making any decision.
Article produced with the assistance of artificial intelligence and reviewed by the editorial team.

 en.cryptonomist.ch