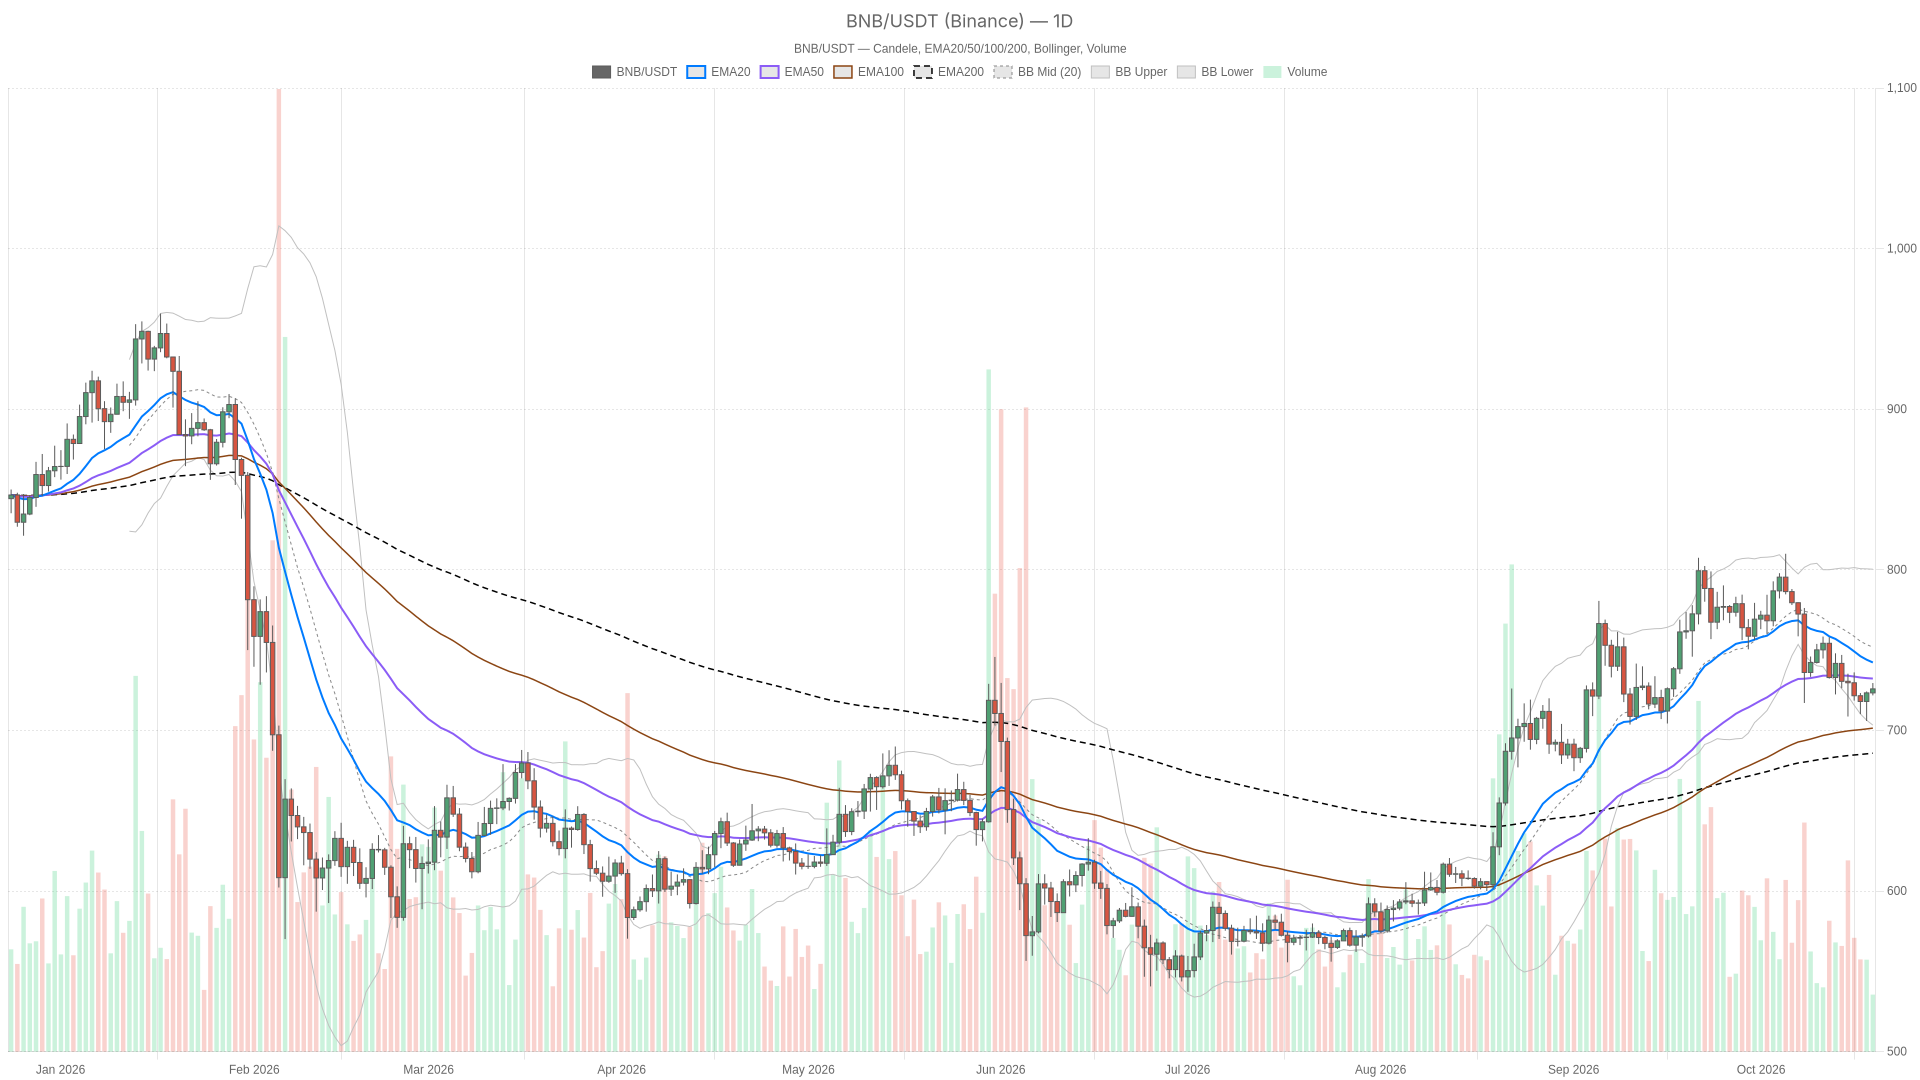
The immediate contest is between improving daily momentum and an hourly rebound that is losing force. That distinction matters: less downside pressure can support mean reversion without establishing a durable advance. Binance supplies the price and candle data used here; the live candle prices are not completed closes.
Binance price recovery lacks agreement across timeframes
The recovery attempt is not confirmed because shorter timeframes do not align with the daily chart’s structure. The daily chart sets a neutral bias rather than an outright bearish one. $BNB remains above its daily EMA200, while trading below the shorter daily averages. The longer-term structure therefore survives, but the current price has yet to reclaim the part of the chart needed to strengthen the recovery case.
The hourly snapshot trades at $725.68, above its EMA20 and EMA50 but below its EMA200. Those averages are not aligned, so the rebound has short-term support without a clean trend structure. The last completed hourly candle closed at $726.60; the live price is below that mark.
The 15-minute chart adds execution friction rather than a separate macro signal. Price is below its EMA20 but above its EMA50 and EMA200, despite bullishly ordered averages. The immediate advance is under pressure before the hourly chart has cleared its overhead barriers.
Bullish daily EMA order does not erase overhead supply
The bullish EMA ordering does not automatically translate into an uptrend because price remains trapped below the daily EMA20 and EMA50. The daily EMA20 at $744.02 sits above the daily EMA50 at $732.55, which in turn stands above the daily EMA200 at $685.41. That is a bullish ordering, but price is below the first two and above the third. The distinction matters: moving-average alignment describes the underlying structure, while price location shows that the current recovery remains incomplete.
Daily Bollinger Bands place the midpoint at $753.46, with the lower band at $706.34 and the upper band at $800.58. $BNB is in the lower half of that envelope. A move toward the midpoint would be consistent with mean reversion, but the nearer moving-average barriers come first; the upper band is not an immediate breakout target.
Daily ATR is $21.59, compared with $3.11 hourly and $1.24 on the 15-minute chart. These readings put the tight intraday levels in perspective: small moves can decide a local setup without resolving the broader daily range.
Daily momentum improves while the hourly rebound loses force
The recovery has traction on the daily chart, but the hourly and 15-minute readings show fading momentum, keeping the bias cautious. Daily RSI is rising at 41.3, still below the midpoint. Hourly RSI stands at 59.5 with a flat recent direction, while 15-minute RSI is falling at 48.0. The daily recovery is gaining some traction, but the shortest horizon is not confirming fresh upside momentum. None of these readings is overbought or oversold.
MACD tells a similarly divided story. The daily histogram remains negative but is narrowing toward zero, indicating that bearish momentum is easing rather than bullish momentum taking control. The hourly histogram is positive but narrowing, so the rebound is losing force. On the 15-minute chart, the histogram is negative with a flat recent direction. Together, these readings favour a cautious recovery thesis over a momentum-breakout claim.
Hourly R1 and S1 define the next directional test
The next decisive move depends on whether $BNB closes an hourly candle above $727.53 or below $725.64.
Bullish scenario: An hourly close above hourly R1 at $727.53 would confirm a break beyond the nearest hourly resistance sequence. The hourly pivot at $726.57 is the first overhead obstacle, but the previous completed hourly candle already finished above it, so reclaiming that level alone would not be a fresh breakout signal. Above hourly R1, the next tests are daily R1 at $729.79, hourly EMA200 at $731.95 and daily EMA50 at $732.55. An hourly close below hourly S1 at $725.64 would invalidate this bullish setup.
Bearish scenario: An hourly close below hourly S1 at $725.64 would turn the immediate weakness into a confirmed local breakdown. The nearest downside references would then be hourly EMA20 at $723.19 and hourly EMA50 at $721.77. A deeper extension would bring the daily pivot at $717.82 into focus, followed by daily S1 at $711.40. An hourly close back above the hourly pivot at $726.57 would invalidate the bearish setup.
The likeliest false signal is a brief push above hourly R1 without a completed hourly close, particularly while hourly MACD momentum is fading. The reverse risk is a temporary dip beneath hourly S1 that quickly reverses. With hourly ATR wider than the immediate pivot-to-support spacing, an intrabar breach carries less weight than a completed candle; neither scenario alone establishes a daily trend change.
Mixed BSC trading volumes offer no uniform confirmation
On-chain trading activity across BSC does not provide a clear directional signal for $BNB because venue-level volumes are diverging. Chain-level data shows $874,820,565.06 in 24-hour DEX trading volume across the BSC blockchain. Venue activity is mixed: PancakeSwap AMM V3 volume is down 18.38% over one day, while PancakeSwap Infinity is up 20.09% and Uniswap V4 is up 116.37%. This is chain-wide trading activity, not $BNB-specific volume, fees or revenue, and the divergent venue readings do not provide a uniform confirmation of the price recovery.
Binance is set to shut down its mining pool, cloud mining and related services. That provides company-level context, but the supplied facts do not establish a link between the planned shutdown and the current $BNB move.
Greed reading contrasts with $BNB’s unfinished recovery
The Fear & Greed Index at 59 signals risk appetite, yet $BNB’s price structure does not confirm that optimism. Alternative.me’s Fear & Greed Index reads 59, classified as Greed. CoinGecko puts total crypto market capitalization at $2.75 trillion and Bitcoin dominance at 60.17%. The sentiment reading leans toward risk appetite, yet $BNB’s daily structure does not confirm an established advance. The capitalization and dominance figures describe the market’s current scale and composition, not a directional change in either measure.
FAQ
Is $BNB’s main scenario bullish or bearish?
Neutral with a defensive tilt. Bullish daily EMA ordering coexists with price below the daily EMA20 and EMA50, so structural support and current weakness remain in tension.
Does the positive hourly MACD confirm a breakout?
No. Its histogram is positive but narrowing; confirmation in the bullish scenario requires the specified hourly close above resistance.
Do the DEX figures measure $BNB demand directly?
No. They cover trading across BSC venues and cannot be treated as $BNB-specific activity.
Disclaimer: This article is for informational purposes only and does not constitute financial advice, an investment recommendation, or a solicitation to buy or sell any financial instrument or cryptocurrency. The analysis provided is not indicative of future results. Investing in crypto assets and financial markets carries a high risk of capital loss. Always do your own research (DYOR) and consult a qualified financial advisor before making any decision.
Article produced with the assistance of artificial intelligence and reviewed by the editorial team.

 en.cryptonomist.ch