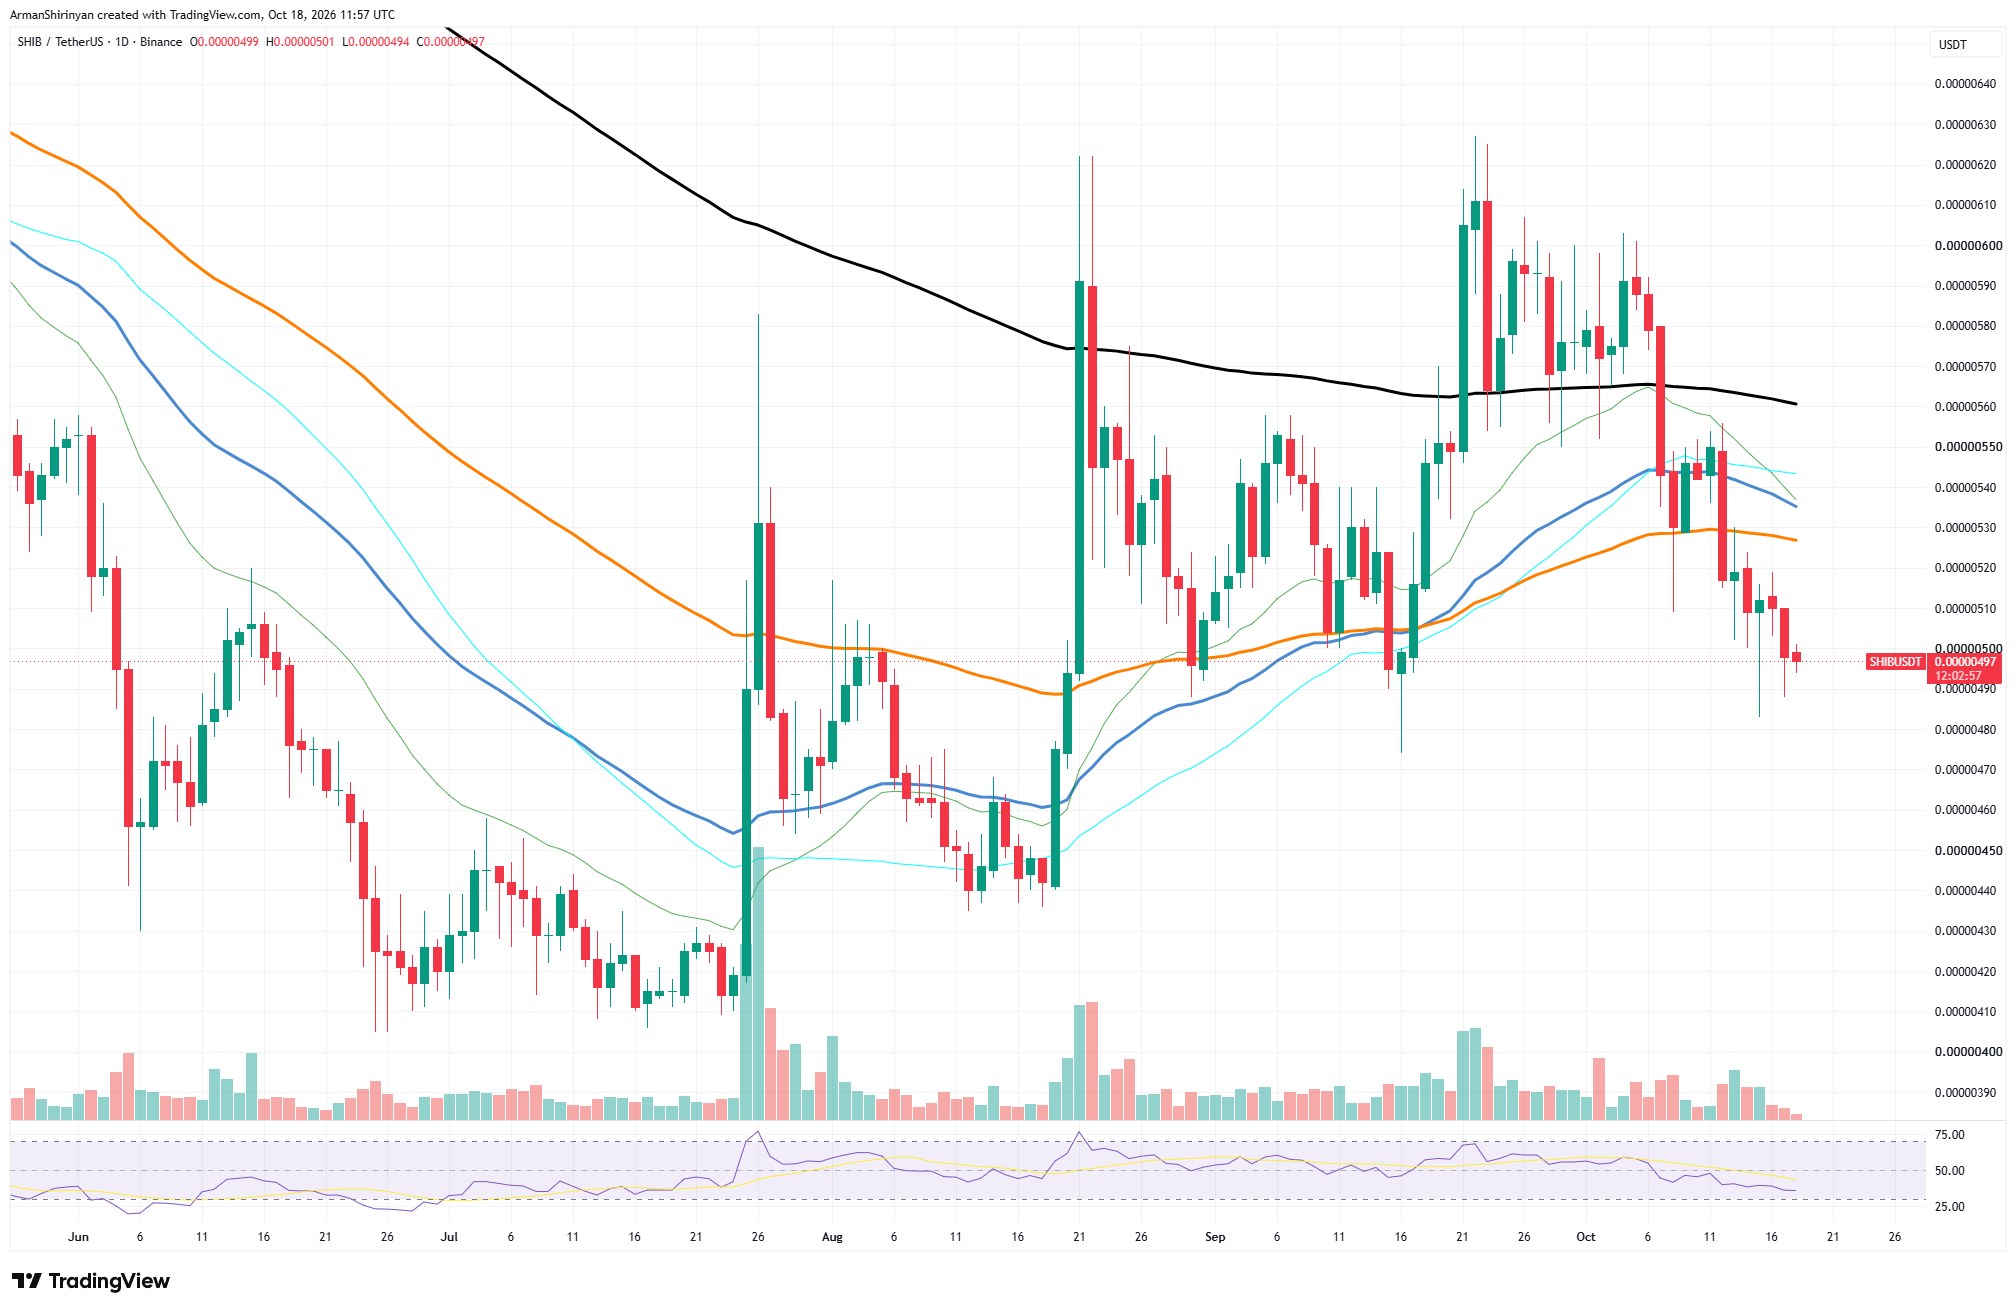
$SHIB trades near $0.00000499, down approximately 1.4% on the day and almost 8% on the week. On the chart, it fell from the $0.00000627 high in September and now sits beneath the 50, 100, and 200-day moving averages. They run from approximately $0.00000527 to $0.00000561 and act as a ceiling.
The RSI is near 37, which indicates weak momentum but not an oversold market. Trading volume has also dwindled since the August and September spikes.
Longer-term dynamic for $SHIB
Support is near. $SHIB bounced from $0.00000483 this week and from $0.00000474 in mid-September.
A daily close below that zone could open the way toward $0.00000440, where buyers stepped in during August. On the upside, the first test is $0.00000527. A move above it would bring $0.00000550 into view, and a full reversal needs a close above the 200-day line near $0.00000561.
Longer-term numbers show the damage. $SHIB is down approximately 28% this year and almost 49% over twelve months, although it is up approximately 20% over 90 days. One positive signal is the OKX long-to-short ratio of 2.76, which indicates many traders still lean bullish.
So the spot flow spike is a small signal, not a reason to buy. Real demand would show up as steady net inflows and rising spot volume together with a close above $0.00000527. Until then, $SHIB is more likely to stay in a tight range above $0.00000474.

 u.today