Crypto Price Analysis, ETH, XRP, HYPE, TIA and Lighter, October 17: Ethereum, XRP and Hyperliquid Remain Under Pressure
thecryptobasic.com
1 h
Ethereum, $XRP, and Hyperliquid face resistance as Celestia rallies and Lighter rebounds. Daily charts identify support levels and breakout tests for each coin.
Asset
Price
Rolling 24-hour change
Aggregate 24-hour volume
Ethereum ($ETH)
$2,425.66
−0.43%
$11.90 billion
$XRP
$1.31
−1.78%
$1.36 billion
Hyperliquid ($HYPE)
$79.99
−1.00%
$642.82 million
Celestia ($TIA)
$0.733617
+21.77%
$302.67 million
Lighter (LIT)
$3.22
+5.38%
$76.72 million
Ethereum: MACD Weakness Eases Without a Bullish Crossover
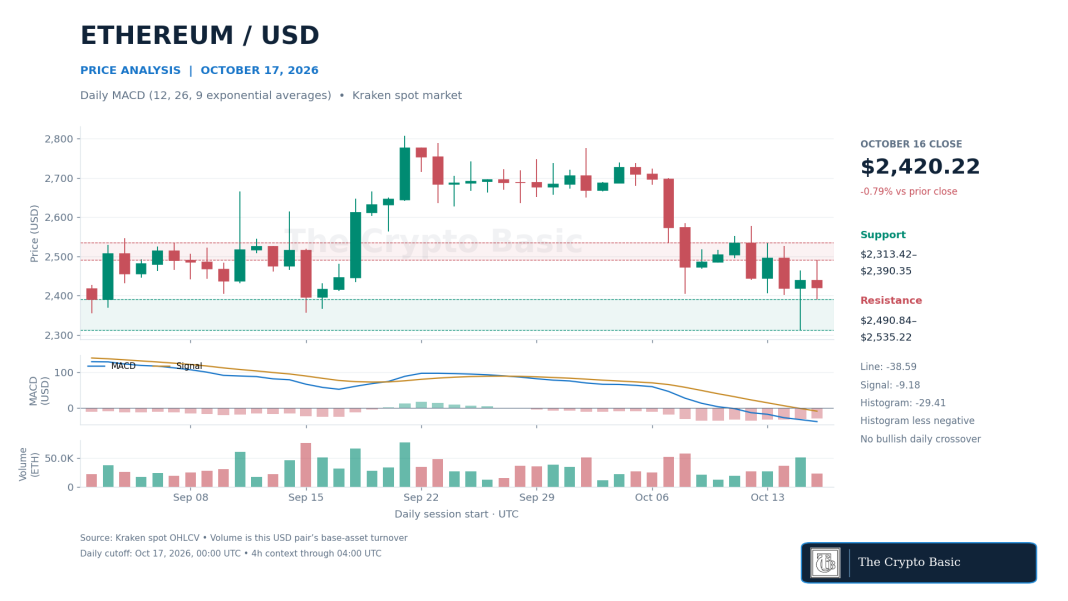
Ethereum closed October 16 at $2,420.22 on Kraken, down 0.79% from the previous daily close. Its $2,490.84 session high failed to extend the recovery, leaving price below the $2,527–$2,535 highs recorded earlier in the week.
Know when your coins move
Alerts, real-time prices, and market news — all in one app
Point your phone camera to install
4.8 based on 40K reviews in the App Store and Google Play
Ethereum’s daily Kraken USD chart shows a narrowing negative MACD histogram, but no bullish crossover. Support lies at $2,390.35 and $2,313.42.
Daily MACD, using 12- and 26-period exponential moving averages with a nine-period signal line, remained negative.
The MACD line stood at −38.59 against a −9.18 signal line. The histogram improved from −31.29 to −29.41, indicating a narrower bearish gap rather than a confirmed bullish crossover.
Four-hour MACD was above its signal line but still below zero at the latest completed candle. That supports a short-term recovery attempt, not confirmation that the daily decline has ended.
A daily price close above $2,490.84 would strengthen the case for another test of $2,527–$2,535. Holding above that second area would weaken the recent lower-high pattern.
A close below $2,390.35 would instead expose the October 15 low of $2,313.42 and invalidate the immediate rebound setup.
Compared with the October 16 report’s $2,435.07 snapshot, $ETH was about 0.39% lower. The focus shifts from moving averages to momentum, but the need to reclaim overhead resistance remains unchanged.
$XRP: RSI Slips as Support Near $1.28 Comes Into Focus
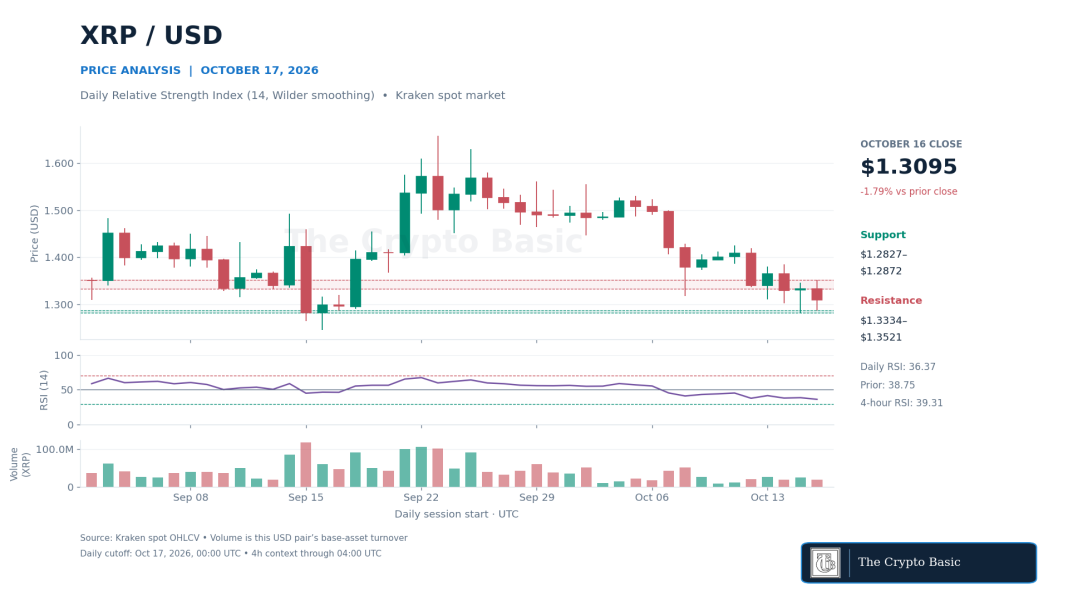
$XRP closed October 16 at $1.30952, down 1.79%. Its daily range remained above the October 15 low of $1.28274, but the lower close showed that the rebound had not established sustained demand.
RP’s daily RSI fell to 36.37 as price held above $1.28274–$1.28724 support. A close above $1.35208 would strengthen the recovery case.
The 14-period daily RSI, calculated with Wilder smoothing, fell to 36.37 from 38.75. That reading remains below the neutral 50 level without reaching the conventional sub-30 oversold threshold.
It indicates weak momentum, not an automatic reversal signal. Four-hour RSI at 39.31 also remained below neutral.
The $1.28274–$1.28724 area contains the lows of the last two completed sessions. A daily close beneath $1.28274 would invalidate that short-term support and bring the September 16 low of $1.24610 back into view.
For a recovery, $XRP first needs to reclaim $1.33338 and then close above $1.35208, Friday’s high.
That would improve the prospects for a move toward $1.38076–$1.38535. Until those levels are recovered, holding support alone does not establish a new uptrend.
The October 15 report used Bollinger Bands. Since then, Kraken’s daily close has fallen from $1.32990 to $1.30952, about 1.53%, reinforcing the weaker momentum picture.
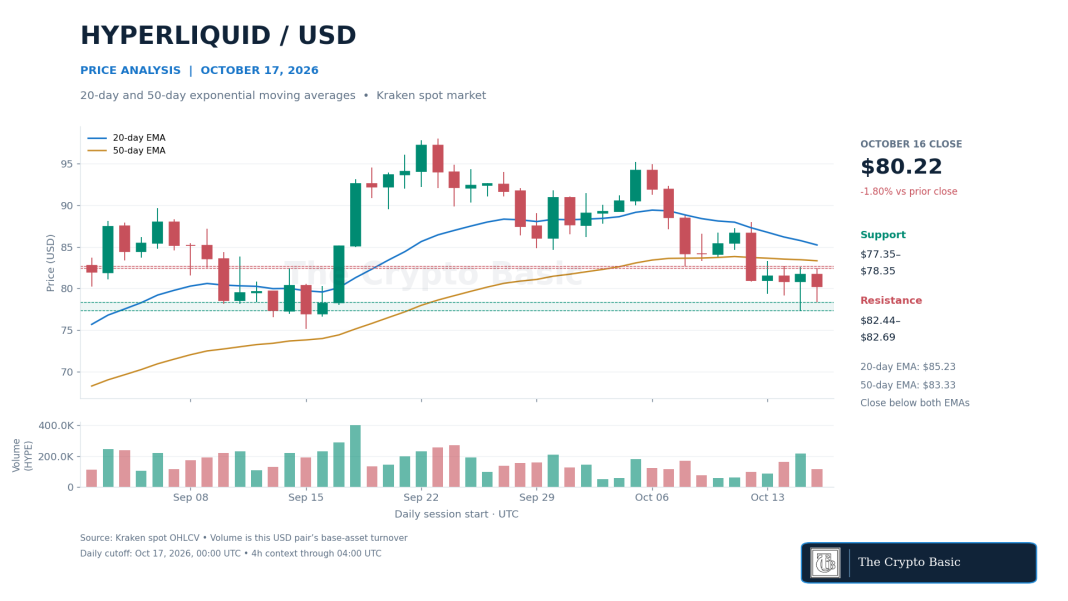
$HYPE closed Friday at $80.22, down 1.80%, after trading between $78.35 and $82.44. Successive highs below $83 since October 14 show that recovery attempts have struggled to regain the earlier trading range.
Hyperliquid closed below its falling 20-day and 50-day EMAs, with support at $77.35–$78.35 and initial resistance at $82.44–$82.69.
The 20-day exponential moving average stood at $85.23 and the 50-day EMA at $83.33. Both declined from the previous session, while price remained below them.
The faster average is still above the slower one, so the latest candle did not produce a fresh bearish moving-average crossover. The immediate weakness comes from price position and the falling averages.
Support sits at $77.35–$78.35, encompassing the October 15 and 16 lows. A daily close below $77.35 would put the September lows around $76.53 and $75.11 in focus.
A close above the $82.44–$82.69 recent-high area would be the first recovery checkpoint. Regaining the 50-day EMA would strengthen that attempt, with the 20-day EMA the next dynamic resistance.
A move back beneath $77.35 would invalidate the near-term recovery case. Search interest alone does not resolve this technical weakness.
Celestia: Breakout Arrives With Higher Exchange Volume
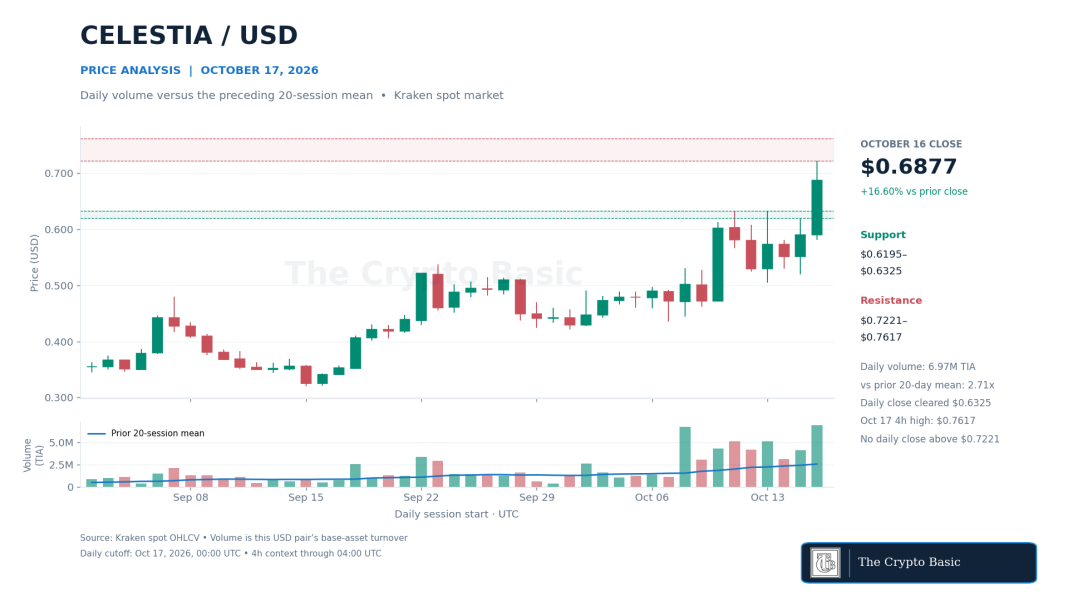
$TIA’s October 16 close of $0.6877 marked a 16.60% daily gain on Kraken and cleared the $0.6321–$0.6325 highs established on October 11 and 13. Unlike an intraday excursion, that move was confirmed by a completed daily candle.
Celestia closed above $0.6325 as Kraken daily volume reached 2.71 times its preceding 20-session average. The $0.7617 level is an October 17 four-hour high, not a completed daily breakout.
Kraken recorded 6.97 million $TIA traded during the session, approximately 2.71 times the mean of the preceding 20 completed sessions.
The higher matching exchange volume gives the breakout more support than a price move on thin turnover. It does not identify the buyers or establish why they traded.
The first completed four-hour candle on October 17 reached $0.7617 and closed at $0.7330, above Friday’s $0.7221 high. However, the daily candle had not closed above that level.
A daily finish above $0.7221 would confirm a further advance, with $0.7617 the next observed price hurdle rather than a guaranteed target.
On a pullback, the $0.6195–$0.6325 breakout area becomes the main retest zone. Closing below $0.6195 would weaken the breakout, while losing Friday’s $0.5808 low would invalidate the latest upward leg and expose the earlier $0.5200 low.
Lighter: Rebound Remains Below the Bollinger Midpoint
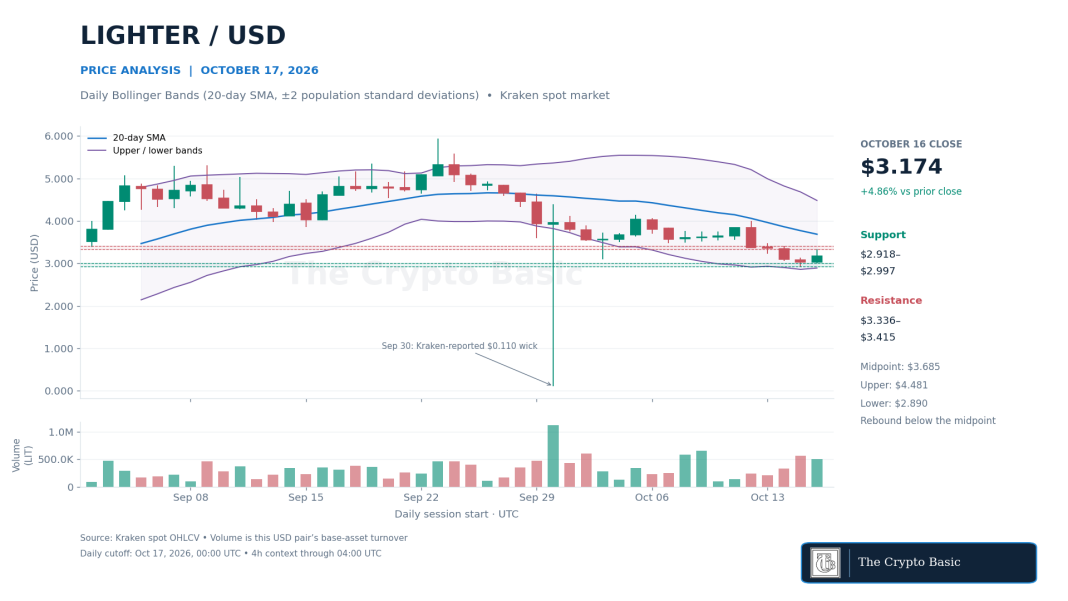
Lighter closed Friday at $3.174 on Kraken’s LIGHTER/USD market, up 4.86%. That recovered the previous day’s $3.133 high, but the close remained beneath Friday’s $3.336 intraday peak and the October 14 high of $3.415.
Lighter rebounded below its $3.685 Bollinger midpoint, with $3.336–$3.415 the nearest resistance area.
Daily Bollinger Bands, calculated from a 20-day simple moving average and two population standard deviations, placed the midpoint at $3.685, the lower band at $2.890 and the upper band at $4.481.
Price rebounded inside the lower half of the envelope, while the midpoint continued to fall. This remains a recovery within a declining trend rather than a confirmed trend reversal.
A daily close above $3.336–$3.415 would clear the nearest resistance area and improve the prospects for a midpoint retest. Because the bands recalculate each session, $3.685 is a current reference, not a fixed future target.
Support is defined by the $2.918 and $2.997 lows of October 15 and 16. A close below $2.918 would invalidate the rebound and put the current lower band in focus.
The completed four-hour close of $3.218 showed early follow-through, but did not clear daily resistance.

 thecryptobasic.com