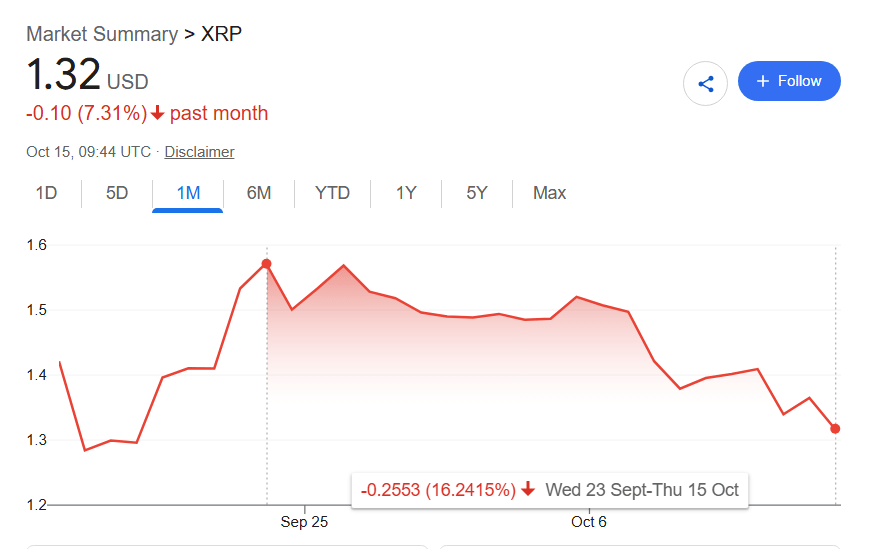
$XRP’s three-week 16% drop from September 23 highs near $1.57 to $1.32 at press time on October 15 might be nearing its end, per the analysis shared by the popular trading expert Ali Martinez on X.
Specifically, the on-chain analyst claims to have identified a parallel channel that the cryptocurrency has been moving in and concluded the token might soon test a critical support zone.
$XRP price chart with performance since September 23 highlighted. Source: Google
Know when your coins move
Alerts, real-time prices, and market news — all in one app
Point your phone camera to install
4.8 based on 40K reviews in the App Store and Google Play
Indeed, $XRP might extend its latest losses to the lower boundary of the chart pattern it has formed – $1.25 – before bouncing from it. Should the level hold, the cryptocurrency is expected to rally toward $1.42 and potentially to as high as $1.60.
Under the circumstances, $XRP might see an additional drop of 5.3% before soaring between 13.6% and 28% from the low – between 7.58% and 21.21% from the press time price of $1.32.
$XRP REBOUND INCOMING!?$XRP appears to be trading inside a parallel channel on the hourly chart.
This structure suggests $XRP could still drop toward the lower boundary around $1.25 before seeing a meaningful rebound.
That’s the level I’m watching for a potential buying… pic.twitter.com/Et9Q11p08w
— Ali Charts (@alicharts) October 15, 2026
Cryptocurrency market crashes on September U.S. inflation data
Meanwhile, $XRP has generally followed the wider cryptocurrency market throughout 2026, and the token’s latest 4% 24-hour drop mirrors the sector.
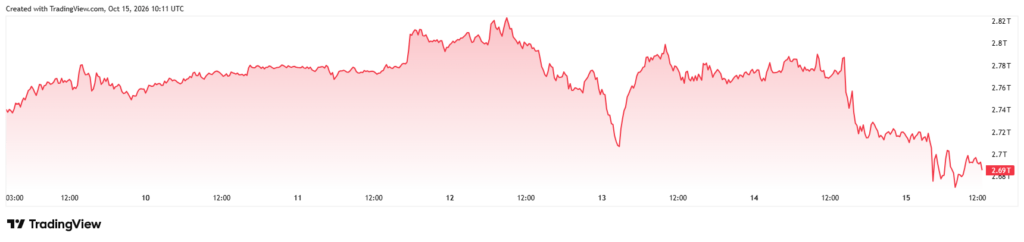
On October 24, numerous stocks, multiple commodities, and most large-cap digital assets fell sharply after news that U.S. inflation rocketed to 3.7% in September.
Total cryptocurrency market capitalization one-week chart. Source: TradingView
The CPI print shifted the risk profile of the economy and, after a period of uncertainty about the Fed’s next move, led to a temporary consensus that there would be at least three additional interest rate hikes by the end of 2027.
Notably, September also featured a 0.25% federal funds rate increase – the first such move since 2023.
Could Bitcoin weakness spoil the $XRP rally?
Circling back to $XRP, Ali Martinez is far from the only notable on-chain analyst to be bullish despite the recent correction.
For example, Michaël van de Poppe, a popular trading expert on X, also stated on October 15 that he estimates the ongoing altcoin downturn toward the asset-relevant support levels is likely to be short-lived, and he estimated that there will be a new rally later in the fourth quarter (Q4).
Still, he also assessed that Bitcoin ($BTC) is showing significant weakness after its failure to break through $84,000. Considering how similarly $BTC, $XRP, and the wider market have been moving through 2026, continued sluggishness for the world’s premier cryptocurrency could bode ill for altcoins.
Honestly, I don't fancy the #Bitcoin chart as much, right now.
It couldn't break through the $84,000 resistance level and is therefore showing weakness.
It seems to be that, if $82,000 is also acting as resistance, the most obvious spot for a long will be <$80,000 as that… pic.twitter.com/Jg3jDv9Ea3
— Michaël van de Poppe (@CryptoMichNL) October 15, 2026
Similarly, the overall technical analysis (TA) that Finbold retrieved from TradingView on October 15 is substantially more bearish regarding $XRP than Martinez.
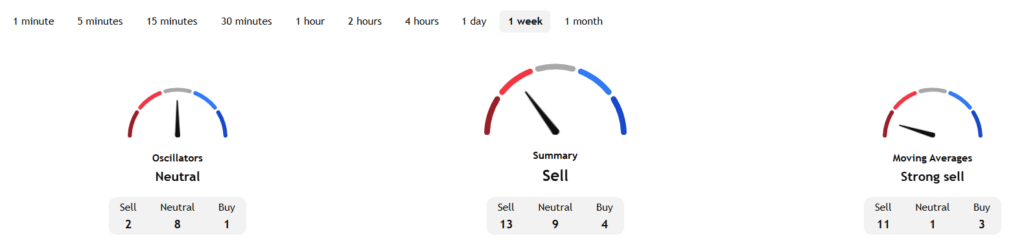
$XRP technicals. Source: TradingView
Whether based on the previous 30, 7, or one day in the cryptocurrency market, the token is rated as either a ‘Sell’ or a ‘Strong Sell’ by moving averages (MA) and the cumulative recommendation, though oscillators notably remain fixed on ‘Neutral.’

 finbold.com