

en
Back to the list

Shiba Inu (SHIB) Invalidates Most Important Support in 2026

source-logo  u.today 14 h
image

Shiba Inu has lost the level that held it up through most of the recovery. $SHIB now trades near $0.00000496 after a daily candle that opened at $0.00000509 and fell as low as $0.00000483. The move pushed the price decisively below the 100 EMA, the orange line near $0.00000528, which had acted as the primary floor since August.

Main support invalidated

This matters because buyers defended that line repeatedly. It was held in late August, again in mid-September, and it was the base for the rally to $0.00000627. Early in October, $SHIB closed below it, attempted to climb back, and failed. Each rebound stopped beneath the line, which turned old support into new resistance. The current red candles confirm that sellers now control the trend.
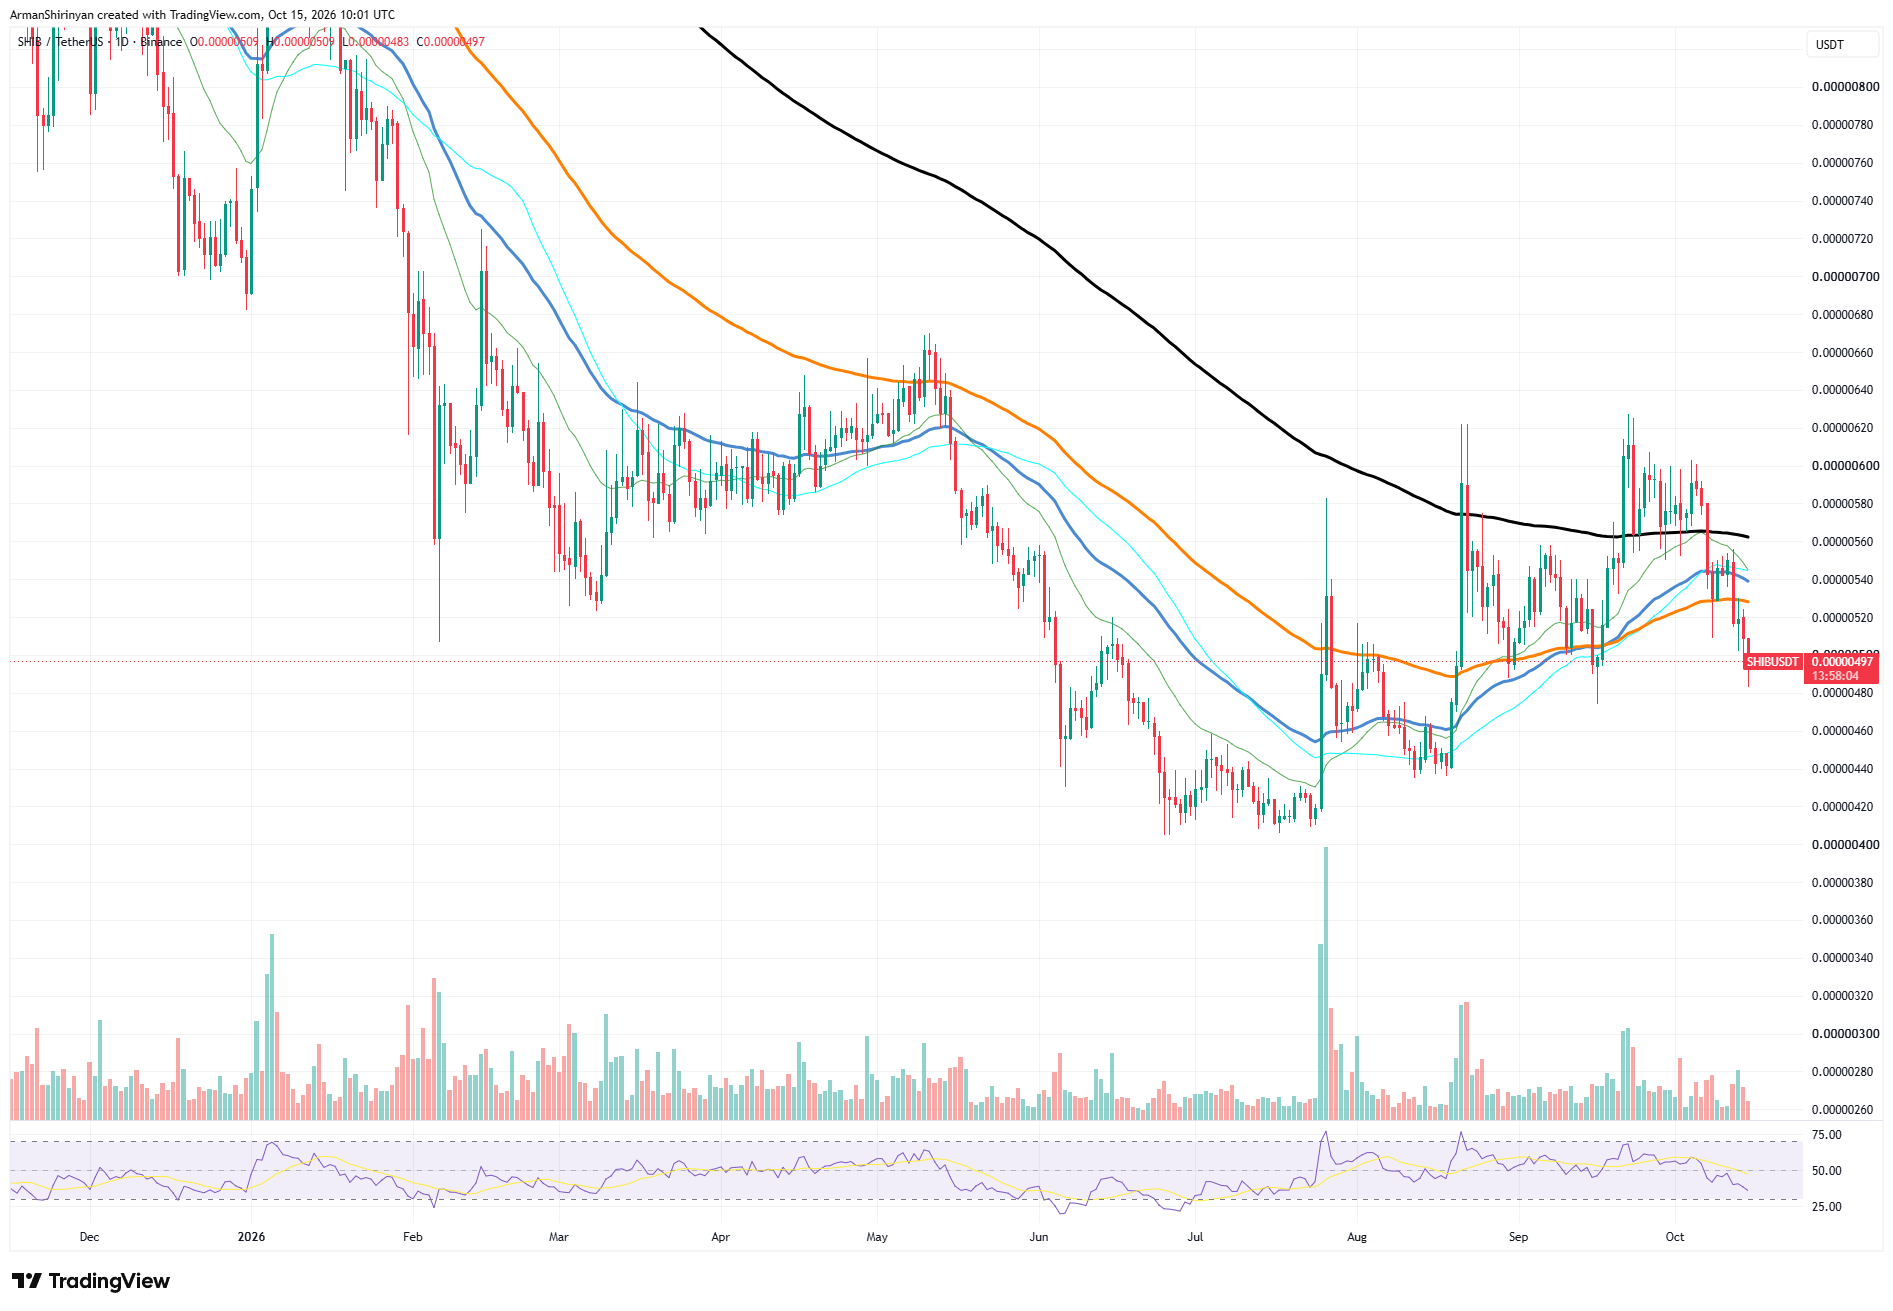

$SHIB/USDT Chart by TradingView
app-logo

Know when your
coins move

Alerts, real-time prices, and market news — all in one app
4.8 based on 40K reviews in the App Store and Google Play

Other averages offer no support from above. The blue and cyan lines sit near $0.00000540 and $0.00000545, and the long 200 EMA near $0.00000562 is even farther away. Price would need a large rally just to test them. The RSI is near 36, close to oversold, which suggests strong selling but not yet a reversal signal. Volume is modest, so the decline is steady, not panicked.

$SHIB left with little support

The chart is now largely empty below, so the supports that remain matter a great deal. The first is $0.00000483, today's low. Under that sits the September dip near $0.00000474, where buyers stepped in before the last rally.

If that breaks, the next area is $0.00000437 to $0.00000440, where $SHIB bottomed in August. The final major support is the $0.00000405 to $0.00000410 zone, the lows from June and July. A fall there could erase the entire recovery of the past three months.

A bounce from $0.00000483 or $0.00000474 remains possible, since the RSI is low. But a bounce alone would not change the trend. It would only show whether buyers can build a base.

Without rising volume, any upward move is more likely a relief rally inside a larger downtrend. For buyers, the job is to reclaim $0.00000500 first, then the 100 EMA near $0.00000528. A daily close above that line would cancel the breakdown. Until then, rallies are likely to be sold.

u.today
