Crypto Price Analysis, BTC, XRP, ONDO, QNT and PUMP, October 15: PUMP Falls 14%, Bitcoin and XRP Test Support, Quant Remains Volatile
thecryptobasic.com
15 October 2026 10:57, UTC
$PUMP falls 14% as Bitcoin, $XRP, $ONDO and $QNT test support. Daily charts map key levels, risks, and technical signals across five major crypto assets today.
Asset
Price
24-hour change
Aggregate 24-hour volume
Rank
Bitcoin
$80,821
-3.45%
$38.57B
1
$XRP
$1.30
-4.92%
$2.25B
5
Ondo
$0.431072
-8.19%
$217.31M
48
Quant
$195.20
-9.34%
$125.65M
39
Pump.fun
$0.004352
-13.66%
$244.31M
49
Bitcoin RSI Weakens as Price Retests $80,300
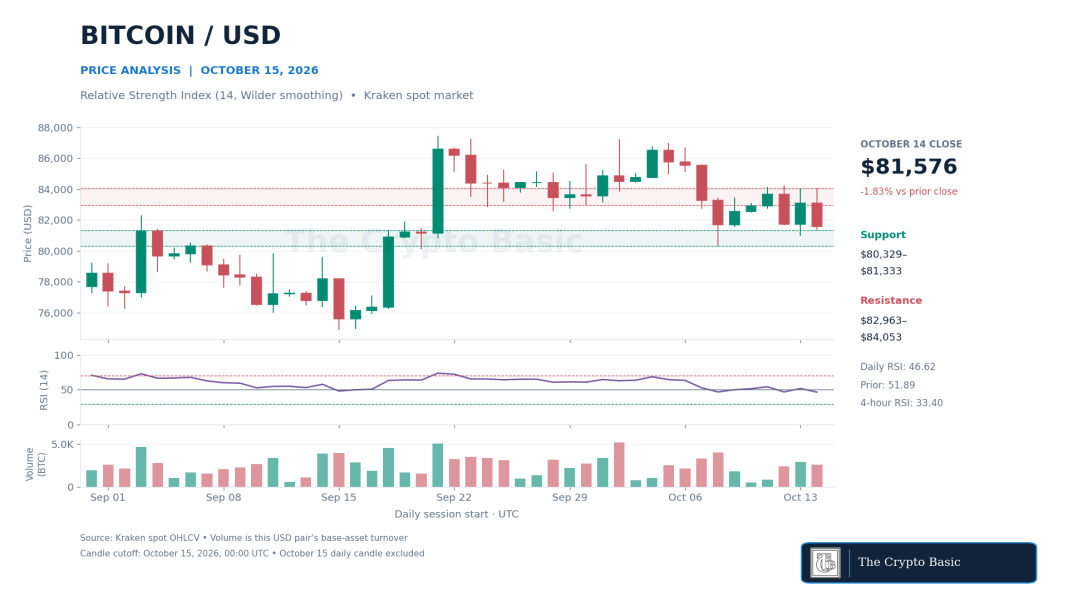
Bitcoin’s completed October 14 candle fell 1.83% to $81,576 after trading between $81,333 and $84,049. Its 14-day RSI, calculated with Wilder smoothing, dropped to 46.62 from 51.89.
Know when your coins move
Alerts, real-time prices, and market news — all in one app
Point your phone camera to install
4.8 based on 40K reviews in the App Store and Google Play
The move below 50 shows weakening momentum without reaching the conventional oversold threshold of 30.
BTC/USD daily chart shows RSI (14) falling below 50 as price approaches the October 8 low near $80,329.
The completed 00:00–04:00 UTC candle closed at $80,828, while four-hour RSI stood at 33.40. The $80,821 market quote remained close to the seven-day low of $80,329, but this intraday test did not establish a confirmed daily breakdown.
A daily close below $80,329–$81,333 would weaken the range and bring the 50-day EMA near $80,257 into focus, followed by the upper-$79,000 area.
Recovering the 20-day EMA at $82,963 would improve the setup, although Bitcoin would still need to close above $84,053–$84,250 to clear its recent ceiling.
$XRP Presses the Lower Bollinger Band
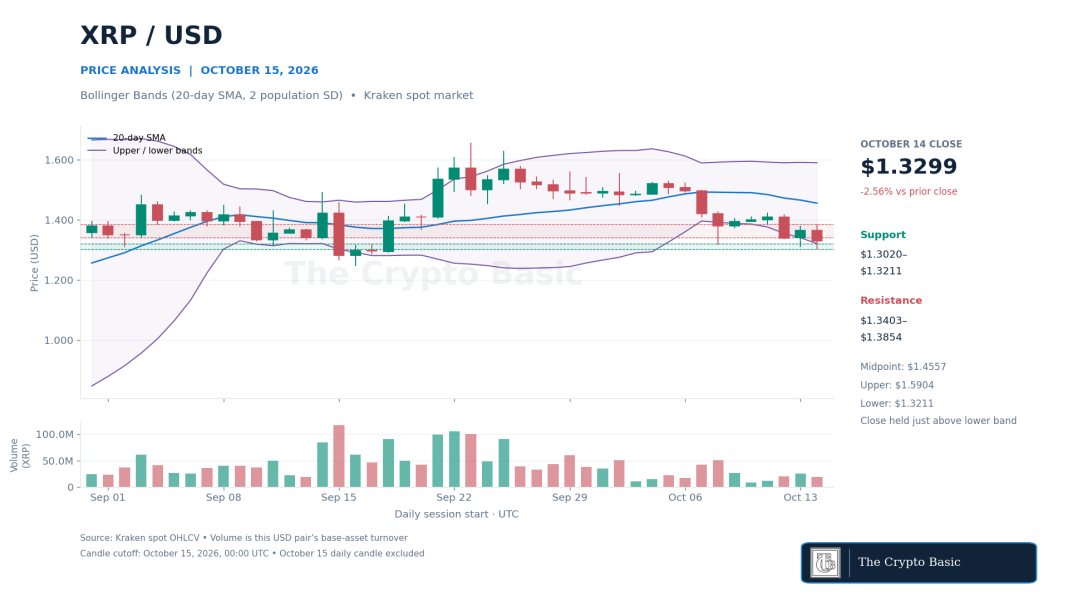
$XRP ended October 14 at $1.3299, down 2.56%, after setting a daily low of $1.3020. The close held just above the lower Bollinger Band at $1.3211, calculated from a 20-day simple moving average with two population standard deviations. The band midpoint stood at $1.4557.
$XRP/USD daily chart shows the October 14 close holding just above the lower Bollinger Band at $1.3211, before further intraday weakness.
The next completed four-hour candle fell as low as $1.2834 and closed at $1.3024. The $1.30 market price was approximately 5.1% below the roughly $1.37 level cited in Wednesday’s report.
Because the current daily candle remained open, the move below the lower band and previous daily low was not a confirmed closing break.
A daily close below $1.3020 would expose $1.2834 and the September 16 swing low near $1.2461.
Holding the lower-band area and reclaiming $1.3403 would begin to stabilize the structure.
A close above $1.3854 would offer stronger confirmation and reopen a move toward the $1.4557 midpoint.
Ondo Sits Between Its 20-Day and 50-Day EMAs
Ondo was the highest-ranked eligible non-core asset on CoinGecko’s search-trending list at the cutoff. It traded at $0.431072, down 8.19% over 24 hours, with a market-cap rank of 48.
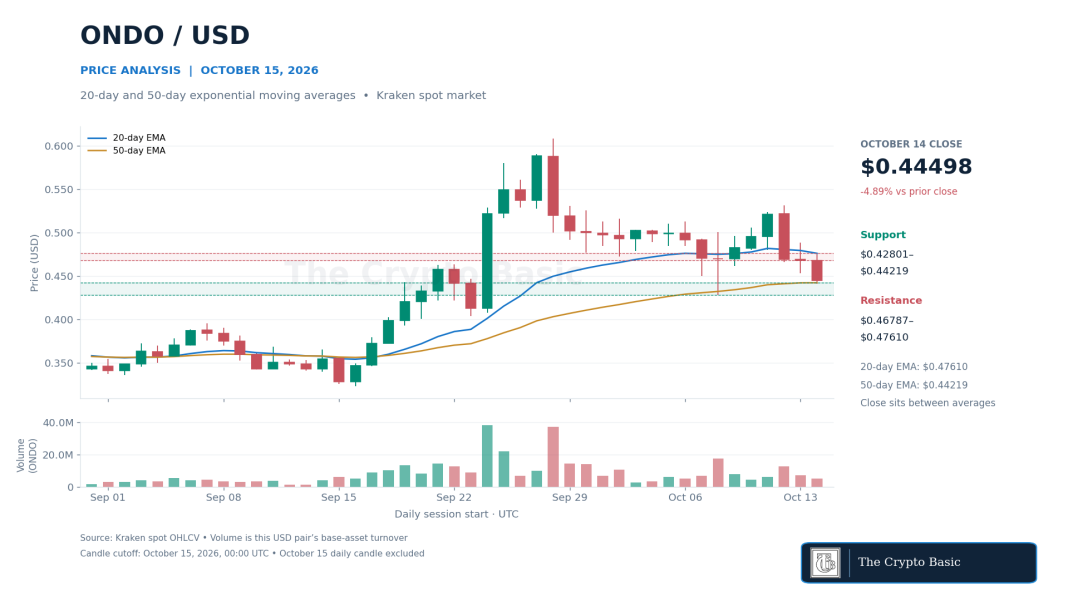
$ONDO/USD daily chart shows the completed close between the 20-day EMA at $0.47610 and the 50-day EMA at $0.44219.
$ONDO’s completed daily candle lost 4.89% to $0.44498. This left price below the 20-day EMA at $0.47610 but marginally above the 50-day EMA at $0.44219.
Its position between the averages describes a compressed decision area rather than a confirmed directional break.
The completed four-hour candle was weaker, closing at $0.42990 after touching $0.42255.
A daily close below $0.42801–$0.44219 would validate the deterioration and place $0.42255, followed by approximately $0.41 and $0.40, at risk.
For a bullish shift, $ONDO must recover $0.46787 and close above the 20-day EMA at $0.47610. That would expose $0.48838 and the psychological $0.50 level.
Quant’s Wide ATR Calls for Closing Confirmation
Quant ranked 39th by market capitalization and appeared among CoinGecko’s most-searched assets as its 24-hour loss reached 9.34%.
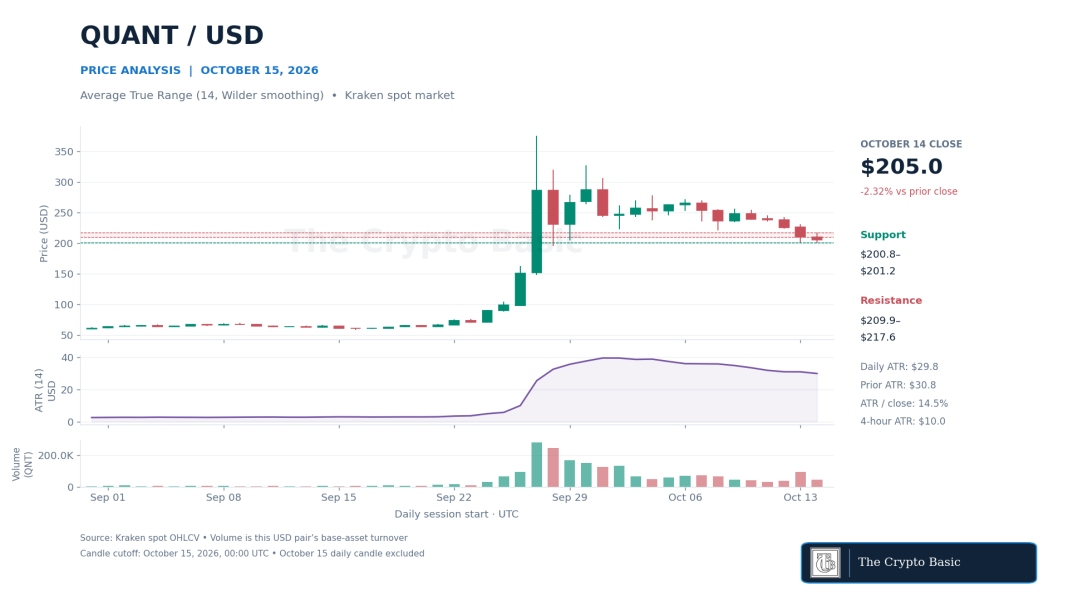
Its completed October 14 candle closed at $205, down 2.32%, before the next four-hour candle fell to $190.44 and closed at $194.51.
$QNT/USD daily chart shows support near $200.79–$201.20, with 14-day ATR measuring $29.80 as volatility remains elevated.
$QNT’s 14-day average true range, using Wilder smoothing, measured $29.80, or 14.53% of the daily close. ATR gauges movement size rather than direction.
The reading eased from $30.83 but remained large enough for intraday wicks to cross nearby levels without confirming a trend change.
The $195.20 live quote was below completed daily support at $200.79–$201.20. A daily close below that zone would confirm a break and put $190.44 in view, followed by the four-hour 200-period EMA near $183.66.
A recovery through $209.87 would ease immediate pressure, while a close above $217.55 would clear the October 14 high and shift attention to $231.15.
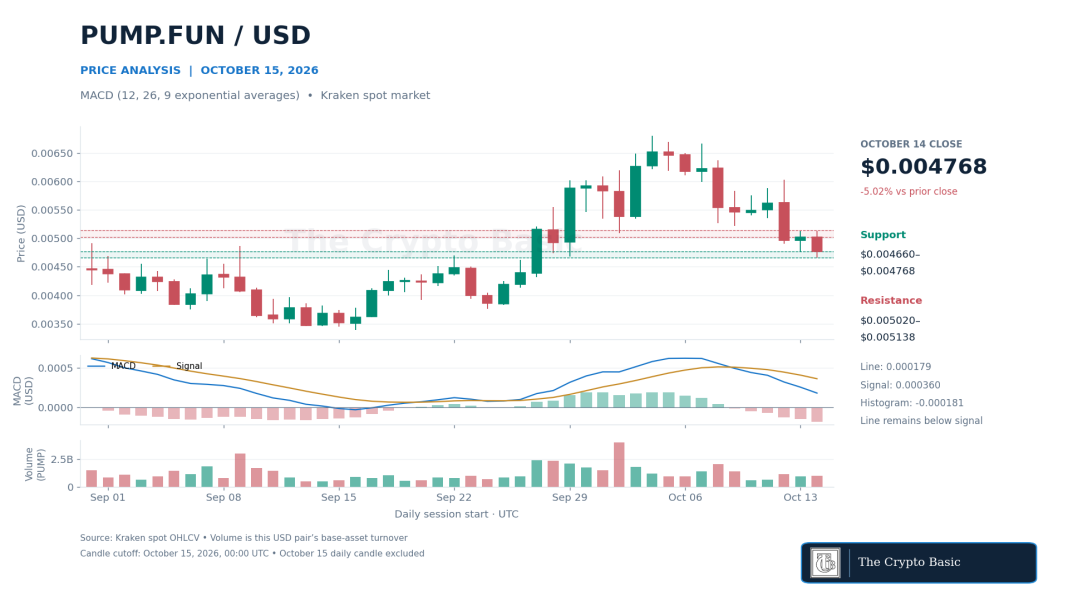
$PUMP MACD Deteriorates as Weekly Loss Reaches 30%
$PUMP recorded the largest 24-hour decline among the five assets, falling 13.66% to $0.004352. It remained a top-100 asset at rank 49 and was down 30.29% over seven days.
$PUMP/USD MACD remains below its signal line as the daily histogram becomes more negative.
Its repeat inclusion follows a material change in the setup: the price was approximately 13.8% below the $0.005050 area recorded in the October 13 report.
The completed daily candle fell 5.02% to $0.004768. On the standard 12,26,9 MACD, the line stood at $0.000179 versus a $0.000360 signal line.
The histogram widened to negative $0.000181 from negative $0.000152. This was not a new crossover; it was a confirmed expansion of negative momentum on a completed daily candle.
The subsequent four-hour candle traded as low as $0.004000 and closed at $0.004347.
That placed the live market below completed support at $0.004660–$0.004768, but only a daily close below $0.004660 would confirm the break.
Such a close would expose the lower Bollinger reference near $0.004211, followed by $0.004000 and the September 25 low at $0.003832.
A close back above $0.005020–$0.005138 would invalidate the immediate breakdown and bring the 20-day EMA at $0.005288 into focus.

 thecryptobasic.com