At the time of writing, $SHIB was significantly down on a 24-hour basis as the markets reacted sharply to hotter-than-expected CPI data.
Consumer prices increased again, keeping the inflation rate well above the Federal Reserve's goal. The consumer price index rose a seasonally adjusted 0.6% for the month, putting the 12-month rate at 3.7%, the Bureau of Labor Statistics reported Wednesday.
Fed officials responded in September by approving their first interest rate hike in more than three years, a quarter-percentage-point move that took the benchmark funds rate to a target range of 3.75%–4%. Markets expect the Fed to skip an October increase but to hike again in December.
Potential scenarios
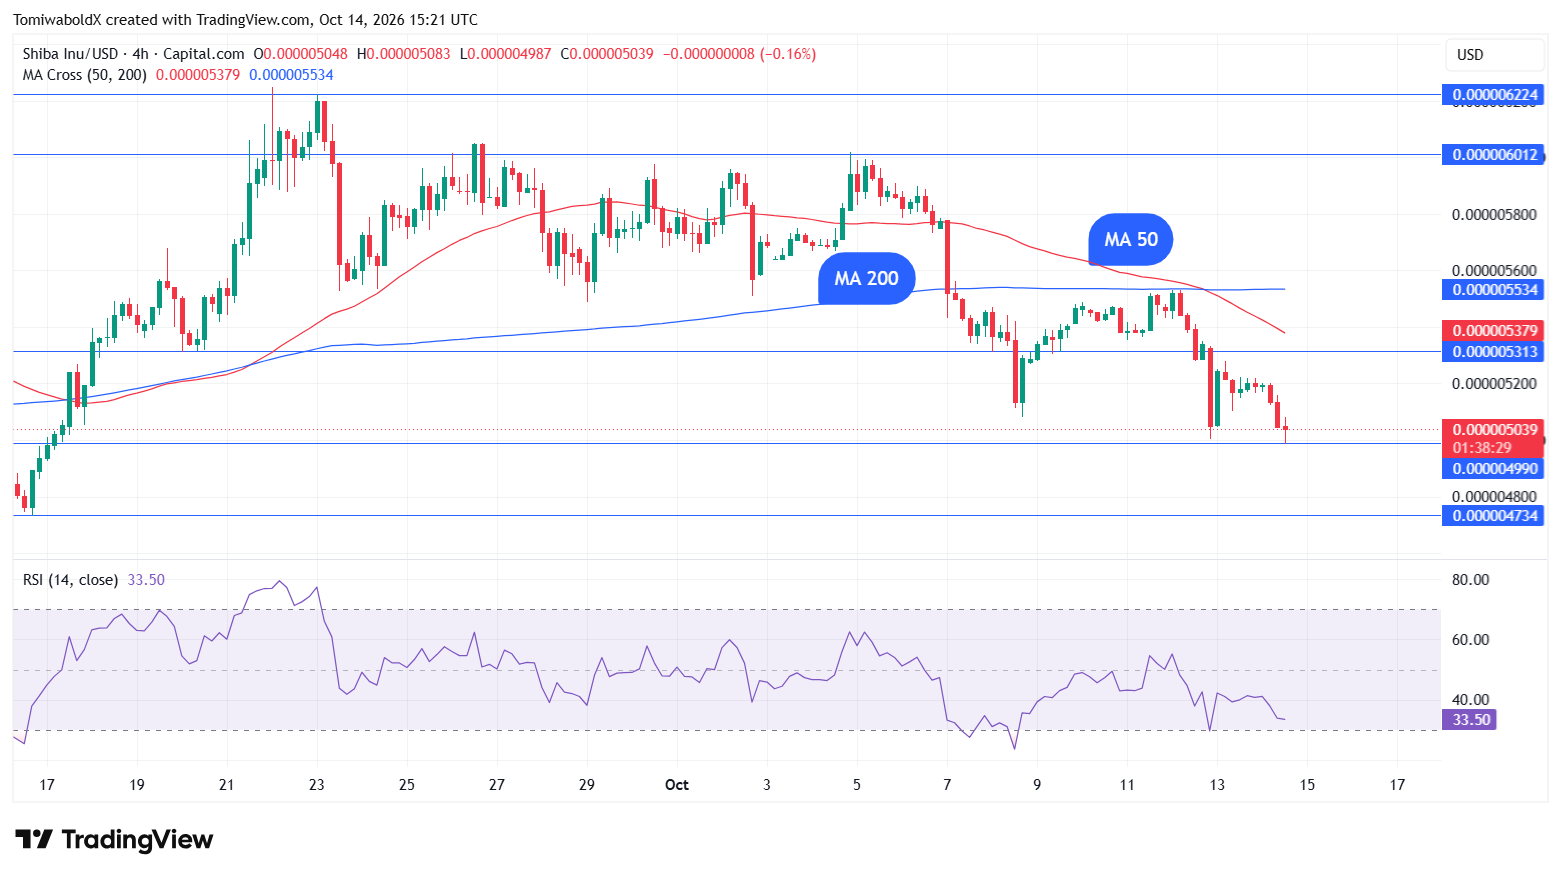
At the time of writing, $SHIB was down 3.88% in the last 24 hours to $0.000005015 amid a weeklong selloff and is down 6.66% over the past seven days.
The recent selloff has brought $SHIB beneath its moving averages, supporting the bearish short-term setup. If $SHIB continues to trade below important support levels, sellers could continue to have the upper hand, potentially exposing it to lower levels; in this case, the $0.000004 level.
However, the crossover alone would not confirm a deeper correction. Traders would also need to watch for price action, trading volume, and whether buyers defend nearby support, which could see $SHIB back above $0.000005 and then $0.000006.
Alternatively, $SHIB could continue to range trade as the short-term bearish signals enter a tug of war with the earlier bullish daily-chart crossover.

 u.today