Solana Price Analysis: SOL Faces $130 Sell Wall as Heavy Orders Test Breakout Hopes
coinedition.com
8 h
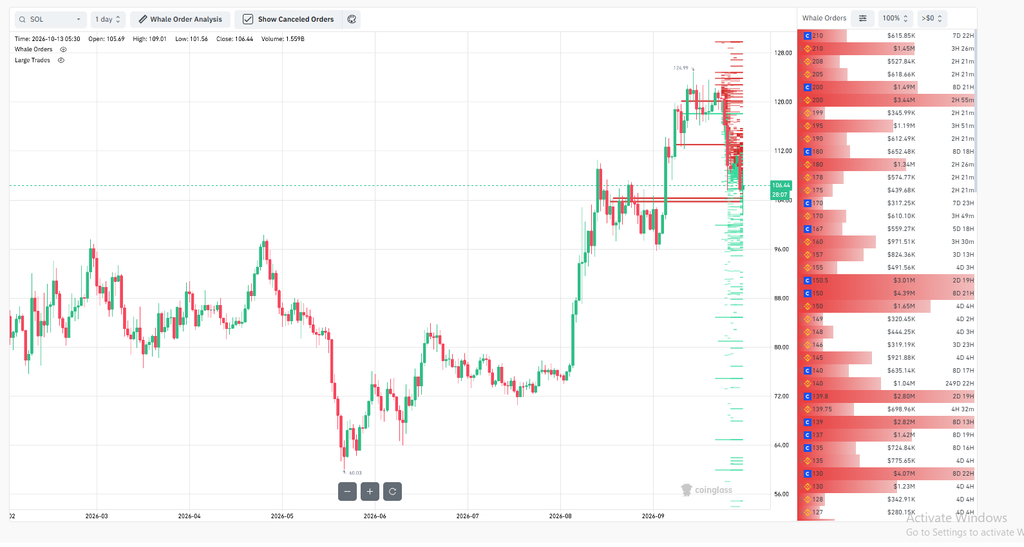
Solana’s retreat toward $106 left several identifiable resistance levels before $130, where CoinGlass recorded a sizable sell entry alongside canceled orders.
CHART PRICE
RECENT HIGH
UNMARKED ENTRIES
UPSIDE REFERENCE
$106.44
$124.99
$1.85M at $127–$130
$130
Rejection Near $125 Leaves Several Levels Before $130
The supplied daily chart showed $SOL token trading at $106.44 on October 13, following a rejection near $124.99. The latest candle also recorded a low of $101.56, reflecting the extent of the recent decline.
Know when your coins move
Alerts, real-time prices, and market news — all in one app
4.8 based on 40K reviews in the App Store and Google Play
Meanwhile, CoinMarketCap reported a 4.54% drop over 24 hours earlier that day, highlighting continued selling pressure. Despite the pullback, the $130 level remains an important upside reference. From $106.44, $SOL would need to gain approximately 22.1% to reach that threshold.
Source: Coinglass
However, buyers would first need to overcome the previous $124.99 high before approaching the overhead sell orders. Therefore, a move toward $130 would represent a recovery milestone rather than a new all-time high.
CoinGlass Separates $130 Sell Interest From Canceled Orders
According to CoinGlass, the whale-order chart displayed approximately $1.23 million in sell interest at $130. Another entry at the same level showed $4.07 million, but its cancellation marker indicated that the order had been withdrawn.
Therefore, combining both figures would overstate the displayed selling interest at that resistance level. Meanwhile, the chart showed $280,150 at $127 and $342,910 at $128 without cancellation markers.
Together, the three unmarked entries totaled approximately $1.85 million, although their current availability remains unconfirmed. Further above, orders worth $2.82 million at $139 and $2.80 million at $139.80 were also marked canceled.
Consequently, these entries represent withdrawn interest rather than active resistance. Moreover, limit orders can disappear before execution, making displayed selling interest an unreliable measure of actual transactions.
ETF Redemptions and Liquidations Accompanied the Retreat
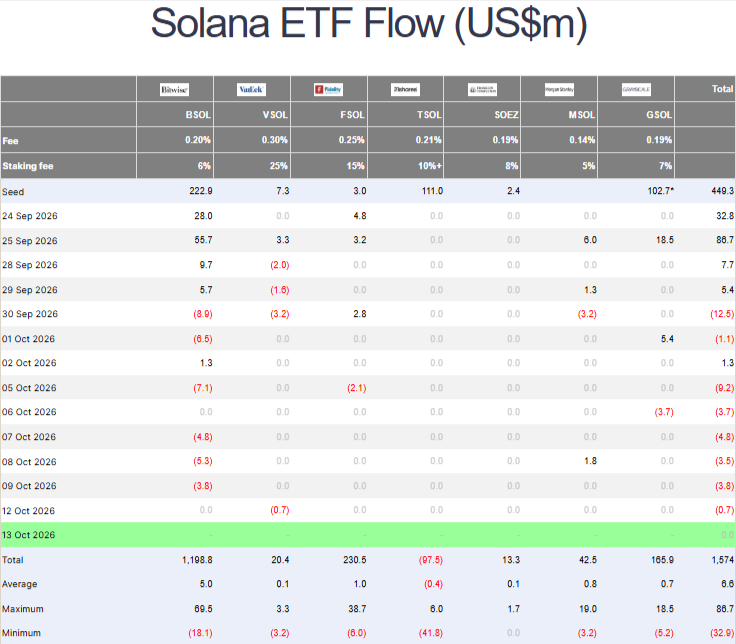
Beyond the order-book activity, institutional fund outflows added to signs of market weakness. According to Farside Investors, U.S. spot Solana ETFs recorded $9.2 million in net outflows on October 5.
Withdrawals continued over the following four trading sessions, bringing the reported weekly total to approximately $25 million. Notably, Bitwise’s BSOL accounted for roughly $21 million.
Source: Farside Investors
Meanwhile, derivatives markets also experienced pressure, with approximately $12.27 million in hourly long liquidations across Binance, Bybit, and OKX. However, the figure covered selected exchanges rather than the entire market.
Although both developments accompanied the decline, neither dataset established a direct connection to the earlier rejection near $125. ETF withdrawals and leveraged-position liquidations represent separate market activities.
Price Levels Distinguish a Recovery From a Breakout
Against this backdrop, the supplied technical analysis identified $110–$112 as the first resistance zone, followed by $120 and the previous $124.99 high. Beyond these levels, additional sell orders at $127, $128, and $130 present further obstacles to a sustained recovery.
However, stronger breakout confirmation would require sustained buying volume, evidence of executed purchases absorbing sell orders, and continued price acceptance above resistance.
Levels That Define the Breakout Test
LEVEL
ROLE
$130
Largest unmarked sell entry
$127–$128
Smaller unmarked entries
$124.99
Recent rejection high
$110–$112
Initial resistance
$105 / $101.56 / $100
Downside references
RECOVERY CASE
A reclaim of $110–$112 and $120 would bring $124.99 into focus. Beyond that high, the chart identifies $127–$130 as further sell-order levels.
FAILURE CASE
Continued trading below resistance would leave $105, the $101.56 candle low, and $100 as chart references, not predicted destinations.
BOTTOM LINE
Overall, the $130 sell wall reflects displayed selling interest rather than guaranteed executable liquidity, as orders can be canceled before execution. Moreover, even a successful breakout above this level would leave Solana well below its historical high of $294.33.
FAQs
1. How Far Away Is $130?
At $106.44, Solana would need to gain approximately 22.1% to reach $130, making the level a significant recovery target.
2. How Much Unmarked Sell Interest Appeared?
CoinGlass displayed approximately $1.85 million in sell orders across $127, $128, and $130. However, their unmarked status does not guarantee that they remain active.
3. Was the $4.07 Million Sell Order Still Outstanding?
No. The $4.07 million order at $130 carried a cancellation marker, indicating that it had been withdrawn rather than remaining available for execution.
4. What Would Confirm A Breakout Above Resistance?
A stronger breakout would require sustained buying volume, executed purchases absorbing available sell orders, and continued price acceptance above the identified resistance levels.
5. Would Reaching $130 Mark a New All-Time High?
No. Although a recovery toward $130 would represent a substantial advance, it would remain well below Solana’s historical peak of $294.33, recorded on January 19, 2025.
Related: Bitcoin Price Analysis: BTC Eyes $87K as Reported $43M Buy Orders Fuel Whale Trap Theory

 coinedition.com