coinpedia.org

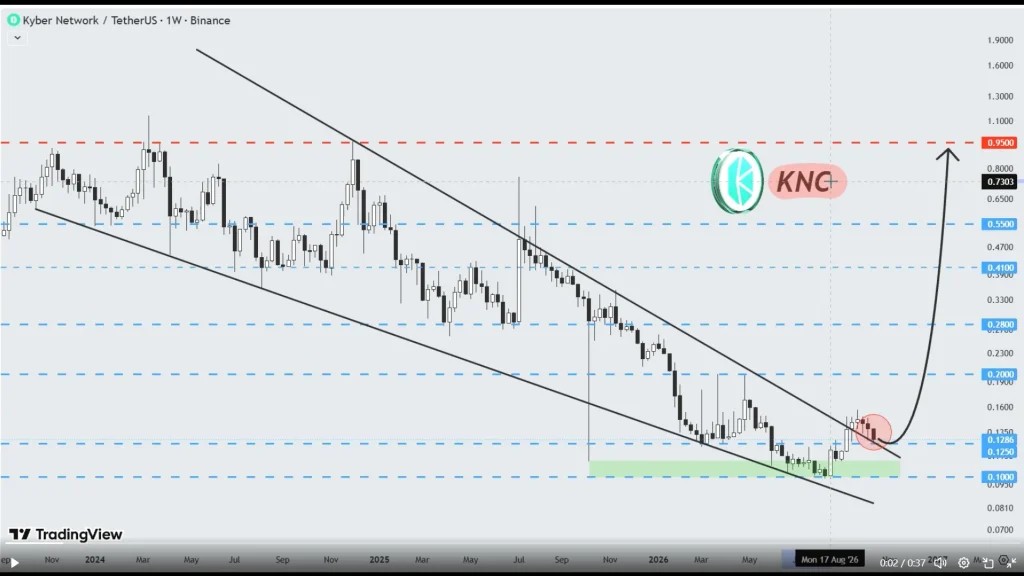
Kyber Network (KNC) is approaching a potential turning point, but a bullish chart setup doesn’t guarantee a rally. The weekly chart shows KNC trading near the upper boundary of a long-term falling wedge, with $0.1286 and $0.1250 emerging as nearby levels to watch. If buyers defend this area and price rebounds, the token could begin a recovery toward higher resistance levels.
KNC Price Faces A Crucial Weekly Test
The chart shows a prolonged downtrend, with KNC recording lower prices over an extended period. However, the recent price action suggests the token is attempting to stabilize after trading close to the lower boundary of the falling wedge.
Now, the immediate question is whether KNC price can hold its current area and build enough momentum to challenge the descending resistance line. A sustained bounce could strengthen the bullish case. Failure to hold support, however, would weaken the recovery setup.