BNB Price Analysis: $674.60 Support at Risk as $800 Rejection Deepens
coinedition.com
15 h
The $800 rejection threatens the recovery structure, while $BNB Chain’s tokenized stock capitalization climbs by $63.6 million weekly.
HEADLINE PRICE
CHART REFERENCE
KEY SUPPORT
RESISTANCE
$674.60
$753.07
$680–$700
$775–$820
$800 Rejection Weakens the Recovery Structure
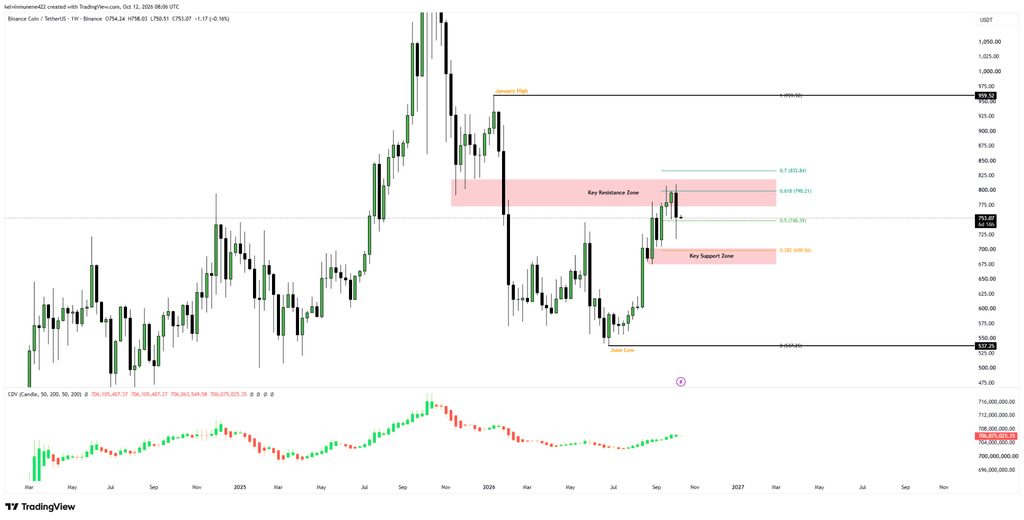
The supplied weekly chart places $BNB/USDT at $753.07, marking a 40.2% recovery from June’s $537.25 low. However, the token’s price remains 21.5% below January’s $959.52 high, indicating that the broader recovery remains incomplete.
Know when your coins move
Alerts, real-time prices, and market news — all in one app
4.8 based on 40K reviews in the App Store and Google Play
Meanwhile, rejection near $790–$800 highlights persistent selling pressure within the $775–$820 resistance zone. The $798.21 Fibonacci level sits within this region, making a sustained breakout important for further upside.
Source: TradingView
On the downside, the chart identifies $748.39 as the 50% Fibonacci midpoint and $698.56 as the 38.2% retracement level. However, the headline’s $674.60 support represents a separate technical reference.
If $BNB falls toward $674.60, the $680–$700 region would become an overhead recovery barrier rather than support. Although the supplied figures do not establish the timing of the $674.60 level relative to the $753.07 chart reading, the distinction is essential when assessing the market’s technical structure.
Fibonacci Levels Define the Recovery Thresholds
From the chart reference of $753.07, a decline to $698.56 would represent approximately 7.2%, exposing a lower technical reference. Conversely, reclaiming $798.21 and breaking above the $775–$820 resistance zone would strengthen the recovery. A decisive move above $820 could then open the way toward $832.84, with $959.52 remaining as the broader upside reference.
The cumulative volume delta indicator provides additional context. It climbed toward approximately 716 million in late 2025, declined substantially through early and mid-2026, then recovered toward 706 million in recent weeks.
Although that recovery indicates improving buying-versus-selling balance under the indicator’s calculation method, CVD remains below its earlier peak. Its interpretation also depends on exchange coverage and indicator settings, making it unsuitable as standalone confirmation.
$BNB Chain Expands Its Tokenized Stock Market
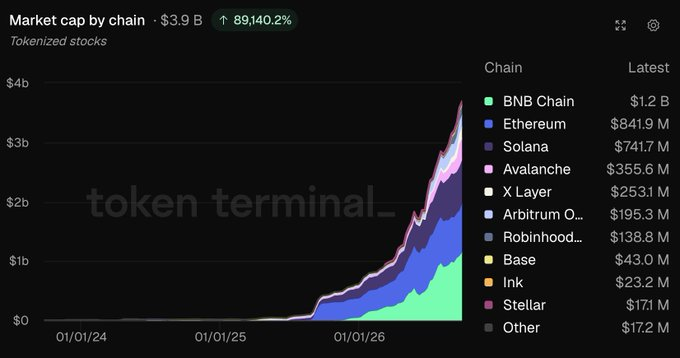
Meanwhile, $BNB Chain is recording growth in tokenized equities. Token Terminal data shared on October 12 shows its tokenized stock market capitalization increased by $63.6 million over seven days, reaching approximately $1.2 billion.
Source: X
This was the largest weekly increase among tracked networks, placing $BNB Chain ahead of X Layer and Ethereum. At the same time, the broader tokenized stocks and exchange-traded funds market approached $3.9 billion in capitalization.
Essentially, tokenized stocks bring traditional financial instruments onto blockchain infrastructure, expanding the real-world asset market. However, this growth does not establish a direct link to Binance Coin’s price movements.
Levels That Define the Next Move
LEVEL
ROLE IN THE MARKET
$959.52
January swing high and broader upside reference
$832.84
Higher Fibonacci reference after resistance clears
$798.21
Major Fibonacci resistance and recovery threshold
$775–$820
Resistance zone surrounding the recent rejection
$748.39
Immediate chart-based support and 0.500 Fib midpoint
$698.56
Lower Fibonacci reference
$680–$700
Marked support zone
$537.25
June swing low and broader downside reference
Bullish Scenario
$BNB’s price reclaiming $798.21 and breaking above $820 could open the way toward $832.84, with $959.52 remaining the broader upside reference.
Bearish Scenario
However, a sustained break below $748.39 would expose $698.56 and the $680–$700 support zone. A move below $674.60 would further deepen the decline, with $537.25 marking June’s swing low.
Bottom Line
Overall, $BNB’s rejection near $800 leaves the recovery facing significant resistance, while $674.60 remains a critical support level to monitor. Meanwhile, $BNB Chain’s tokenized stock capitalization climbed to $1.2 billion after a $63.6 million weekly increase.
FAQs
1. What Is $BNB’s Immediate Support?
The headline identifies $674.60 as critical support, while the chart marks $748.39 as its Fibonacci midpoint.
2. Why Does the $800 Rejection Matter?
$BNB faced resistance near $790–$800. A sustained breakout above $820 would strengthen the recovery structure.
3. What Are the Key Fibonacci Levels?
Key levels are $698.56, $748.39, $798.21, and $832.84, with $959.52 marking January’s high.
4. What Does CVD Indicate?
CVD recovered toward 706 million but remains below its previous peak near 716 million, leaving buying pressure unconfirmed.
5. How Much Did $BNB Chain’s Tokenized Stock Market Grow?
Tokenized stock capitalization increased by $63.6 million in seven days, reaching approximately $1.2 billion.
Related: Ethereum Price LIVE: ETH Eyes $2,810 as Buyers Absorb Selling Pressure

 coinedition.com