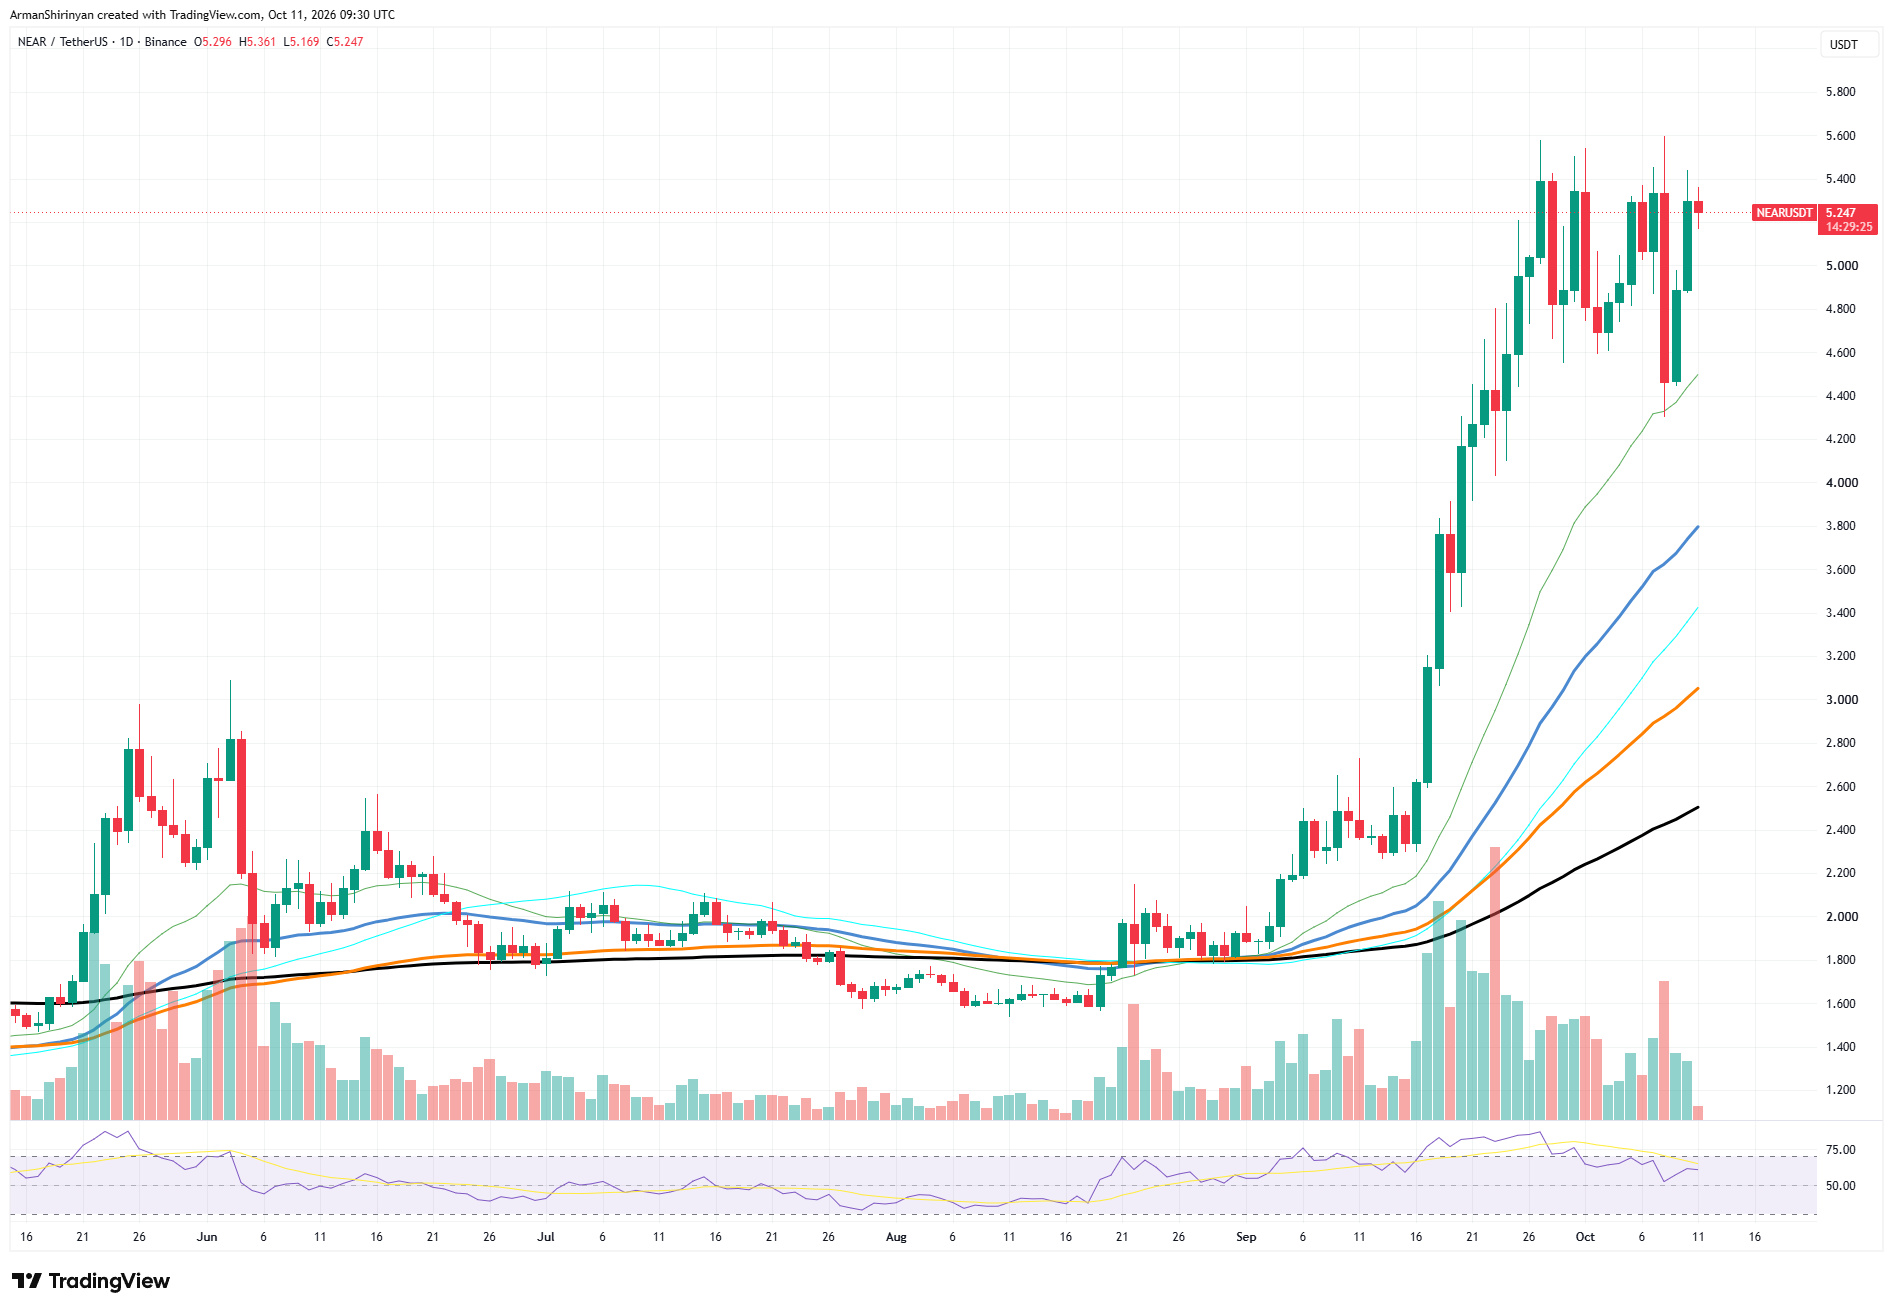
The daily chart still favors buyers. Price remains well above its main moving averages, and the sharp drop to about $4.30 was fully bought back. Volume has been lighter in recent days, though, so the market is waiting for a clean move.
Scenario 1: Breakout
If $NEAR closes a full day above $5.65 with strong volume, the ceiling is broken. The next targets are around $6.00, then the round $6.50 level. A bounce from the $5.00 area would support this view. Volume should also expand on the breakout day and hold up on any retest, which would show that buyers are willing to defend the new level.
Scenario 2: Rejection
If price fails once again between $5.30 and $5.60, a pullback is likely. The first support sits near $4.90, then near $4.45, where the recent sell-off stopped. If $4.45 breaks, the bullish setup weakens and price could test $4.00. A close below $4.90 would be an early warning that the pullback is deepening, so it helps to decide in advance how far price can move before you change your view.
Watch the daily close. A close above $5.65 turns the chart strongly bullish. A close below $4.90 is an early warning sign. Until $NEAR holds above the top of this range, the safer view is that it remains stuck between these levels.

 u.today