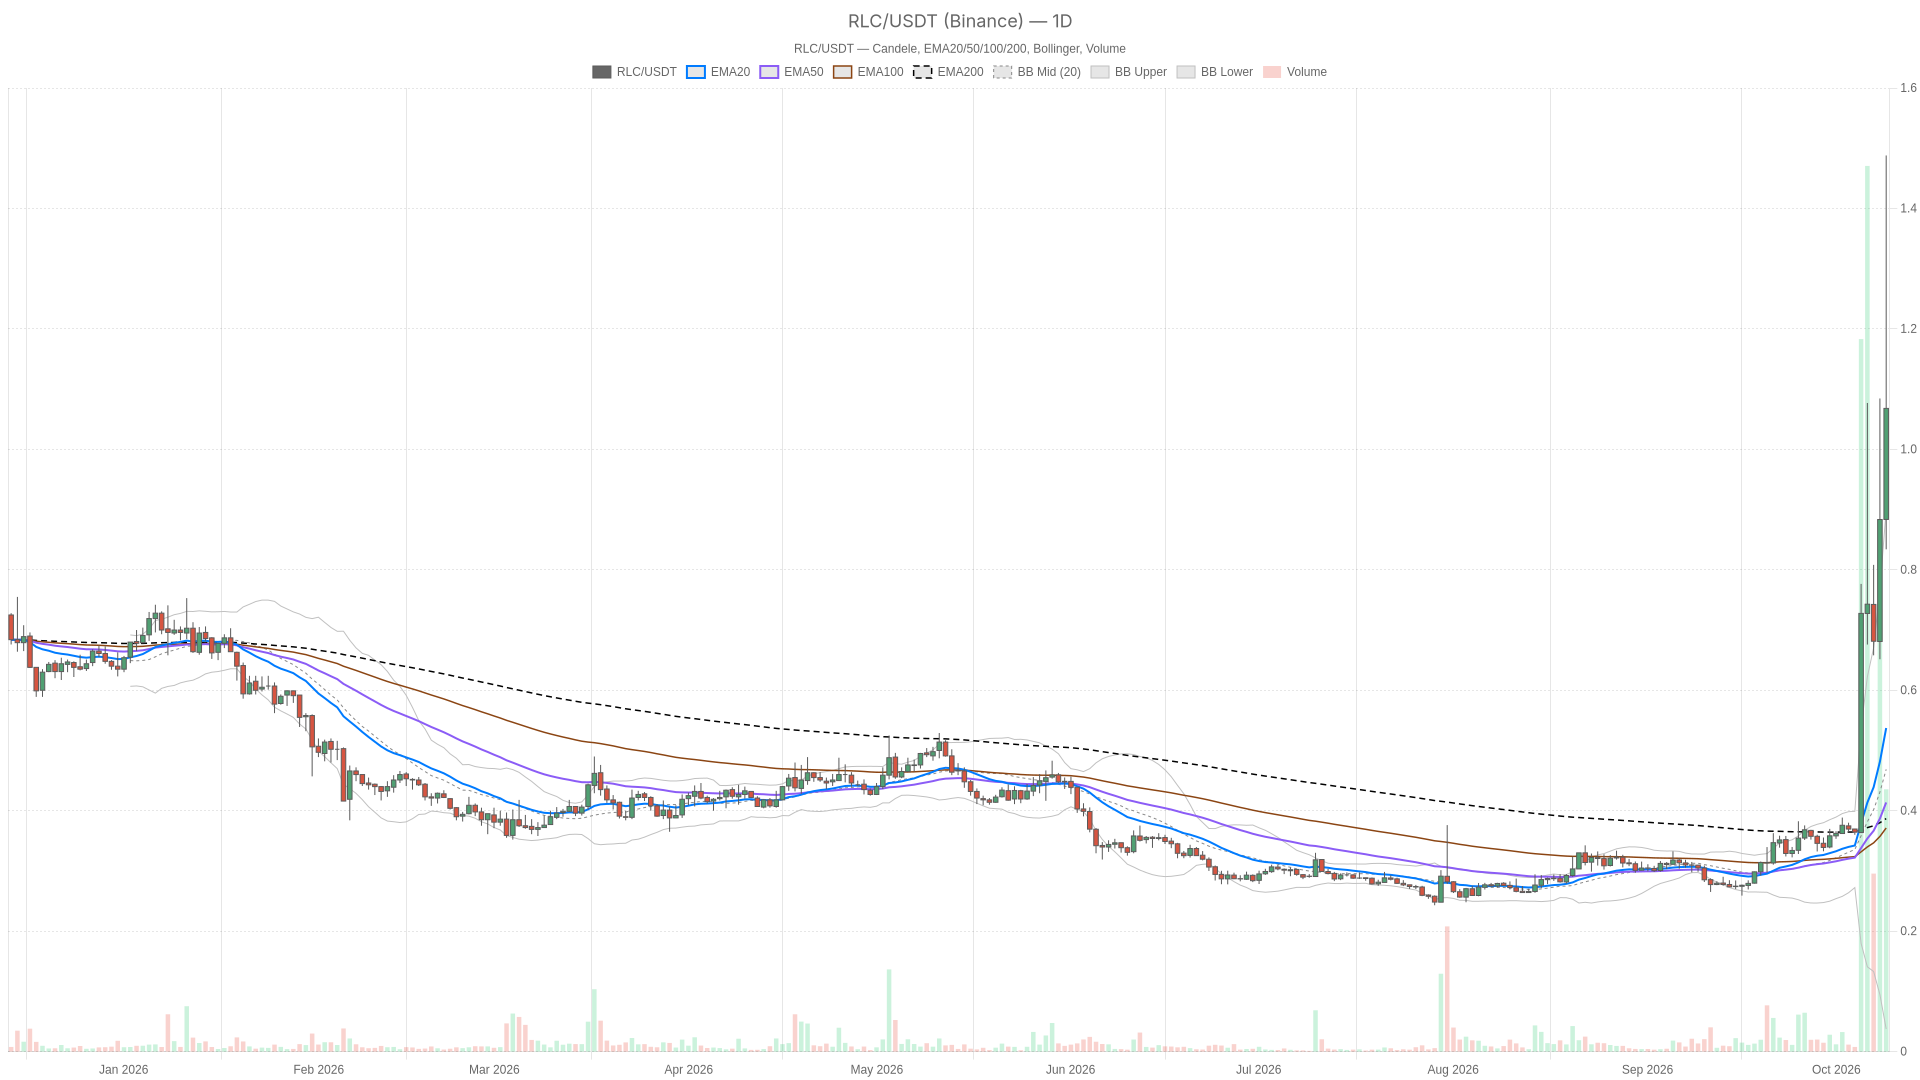
The distinction matters: completed daily and hourly candles show strong momentum, yet the live price is below the last completed hourly close of $1.28. Those signals are not mutually exclusive. They describe an extended bullish trend whose latest pullback has not yet broken the broader structure.
Bitcoin dominance at 59.06% frames a cautious backdrop
Bitcoin dominance at 59.06% frames a cautious backdrop but does not directly confirm demand for $RLC.
CoinGecko puts Bitcoin dominance at 59.06%, while Alternative.me’s Fear & Greed Index reads 59, classified as Greed. These broad-market readings provide context rather than confirmation. Constructive sentiment does not resolve the tension between $RLC’s bullish daily trend and its weaker immediate price action.
The iExec $RLC price retains bullish structure despite a short-term break
$RLC retains a bullish daily structure because the price remains above all three daily EMAs, whose alignment is intact.
Binance-based daily averages are bullishly aligned: the EMA20 is $0.4814, the EMA50 is $0.3870 and the EMA200 is $0.3801. The live price is above each one. That supports a bullish primary bias. The substantial separation from those averages also means a pullback could deepen without immediately reversing the daily trend.
The hourly chart confirms that structure. Price remains above the hourly EMA20 at $0.9113, EMA50 at $0.8168 and EMA200 at $0.6148, with the averages also bullishly aligned. The hourly EMA20 is the nearest listed support on that timeframe, making it a more immediate structural test than the much lower daily averages.
Execution conditions are less convincing. On the 15-minute chart, price is below the EMA20 at $1.08 but above the EMA50 at $0.9720 and EMA200 at $0.8349. The averages themselves remain bullishly aligned. This represents a break in short-term price strength, not yet a complete reversal of the moving-average structure. The 15-minute chart weakens the timing of the bullish case without overriding the daily bias.
Overbought momentum conflicts with fading 15-minute strength
Daily and hourly RSI readings are overbought but still expanding on completed candles, while the 15-minute chart shows momentum fading.
Daily RSI stands at 85.5 and hourly RSI at 81.3, both overbought. Hourly RSI is rising across the last three completed readings, while daily RSI has mixed direction. The market is stretched, but the daily reading alone does not establish that momentum is fading.
Daily and hourly MACD histograms are positive and widening across their last three completed readings. That supports the trend-continuation case on completed candles. The disagreement appears on the 15-minute chart: its positive histogram is narrowing, and RSI is falling to 58.8. Immediate momentum is weakening even as the higher-timeframe evidence remains bullish.
The daily Bollinger Bands place the upper band at $0.7673, the midpoint at $0.4310 and the lower band at $0.09461. Price trades above the upper band, underscoring how extended the daily move is relative to that completed-candle range. By contrast, the live hourly price is below the hourly upper band at $1.15. $RLC therefore combines a large daily extension with an intraday retreat, rather than uniform strength across timeframes.
Meanwhile, ATR is $0.1058 on the daily chart, $0.1040 on the hourly chart and $0.08176 on the 15-minute chart. The hourly reading is close to the daily reading, highlighting substantial short-term movement. Small breaks around nearby levels consequently need to be distinguished from sustained acceptance beyond them.
Daily R1 is the bullish test; hourly EMA20 defines breakdown risk
The nearest critical levels are daily R1 at $1.09 for bullish confirmation and the hourly EMA20 at $0.9113 for breakdown risk.
The nearest listed overhead barriers are hourly S1 at $1.09 and daily R1 at $1.09. They are separate levels that display the same price after rounding. Despite its S1 label, hourly S1 is resistance at the current price, not support. Above it, the hourly Bollinger upper at $1.15 and hourly pivot at $1.29 mark further resistance.
Bullish scenario: a daily close above daily R1 at $1.09 would confirm acceptance beyond the nearest daily resistance. The last completed daily candle closed at $0.8835, so that trigger remains unfulfilled. Such confirmation would strengthen the case for testing the higher hourly barriers. A subsequent daily close below the daily pivot at $0.8732 would invalidate this continuation scenario.
Bearish scenario: an hourly close below the hourly EMA20 at $0.9113 would turn the immediate pullback into a structural breakdown on that timeframe. The last completed hourly close was above that threshold, so this trigger also remains pending. The next downside references are the hourly Bollinger midpoint at $0.8828 and the daily pivot at $0.8732. An hourly close back above hourly S1 at $1.09 would invalidate this breakdown scenario.
Consequently, the likeliest false signal in this reading is a brief push through nearby resistance that fails to survive a completed candle. Overbought higher-timeframe RSI, weakening 15-minute momentum and substantial ATR make an intrabar breakout less persuasive than closing confirmation. A bearish hourly trigger would weaken the bullish daily case, but would not by itself erase it.
FAQ
Which timeframe sets $RLC’s main bias?
The daily chart sets a bullish bias: price is above all three daily EMAs, and their ordering is bullish.
Are the quoted live prices completed candle closes?
No. Binance’s live daily price is $1.07; the last completed daily candle closed at $0.8835. The distinction is essential when evaluating the daily breakout trigger.
Disclaimer: This article is for informational purposes only and does not constitute financial advice, an investment recommendation, or a solicitation to buy or sell any financial instrument or cryptocurrency. The analysis provided is not indicative of future results. Investing in crypto assets and financial markets carries a high risk of capital loss. Always do your own research (DYOR) and consult a qualified financial advisor before making any decision.
Article produced with the assistance of artificial intelligence and reviewed by the editorial team.

 en.cryptonomist.ch