Cardano Bulls Still Need $0.32–$0.40 for Higher Price levels
thecryptobasic.com
07 October 2026 17:45, UTC
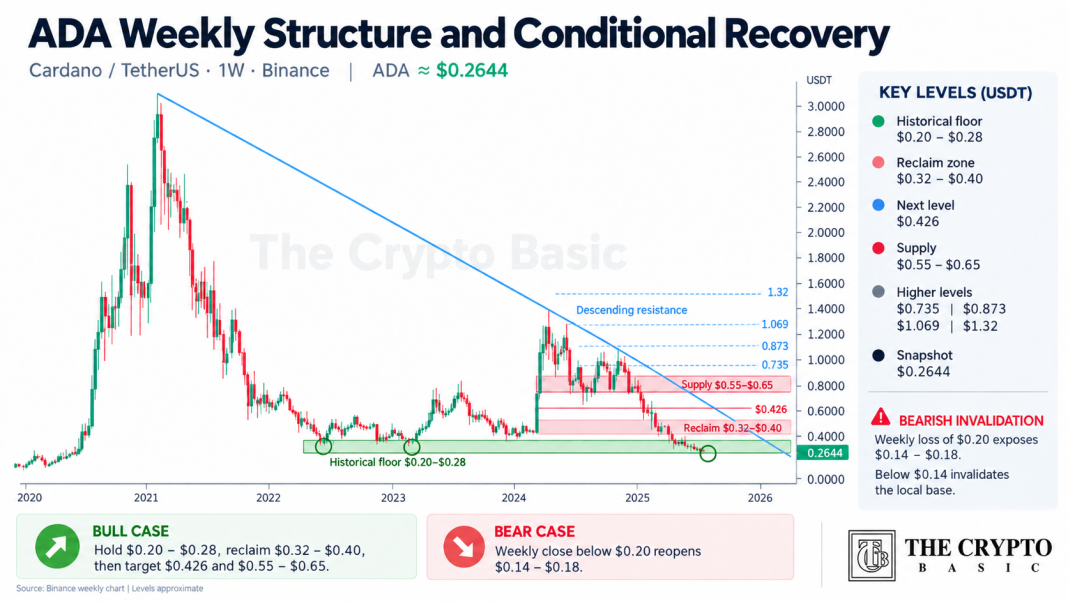
Cardano ($ADA) is testing its historical $0.20-$0.28 floor, with $0.32-$0.40 becoming the first recovery zone, while a break below $0.20 would reopen deeper downside.
Cardano is back inside a price zone that has repeatedly acted as a floor in earlier cycles, with $ADA trading around $0.2644 on the weekly chart.
The $0.20-$0.28 area is now the first line of defense, while a recovery above $0.32-$0.40 would be needed to show that the broader downtrend is beginning to change.
Know when your coins move
Alerts, real-time prices, and market news — all in one app
4.8 based on 40K reviews in the App Store and Google Play
The Binance $ADA/USDT weekly chart still carries a clear long-term weakness: each major recovery since the 2021 peak has produced a lower high.
A descending resistance line continues to cap the broader structure, leaving $ADA below the trend that has controlled price for years.
$ADA weekly chart shows price near $0.2644 inside the historical $0.20-$0.28 demand zone. Bulls need to reclaim $0.32-$0.40, while a weekly break below $0.20 would expose the $0.14-$0.18 area.
At the same time, the latest decline has brought $ADA back into an area where buyers previously stepped in.
$0.20-$0.28 Is $ADA’s Immediate Base
The chart highlights $0.20-$0.28 as a historical floor. $ADA has tested this region several times across previous market phases, and the latest bounce has again started from the same broad area.
At $0.2644, price remains inside that support band rather than decisively above it.
That makes the next few weekly closes important. Holding the zone would keep the local-base argument alive.
A move back toward $0.32-$0.40 would be the first meaningful improvement because $ADA would begin reclaiming levels lost during the latest decline.
From $0.2644, a move to $0.32 represents roughly 21% upside, while a recovery to $0.40 would require about 51%.
Bulls Need to Reclaim $0.32-$0.40
The bullish case does not depend on one green weekly candle.
$ADA would first need to reclaim the $0.32-$0.40 region, then hold that area on a pullback. That would establish a higher support zone and give the recovery more structure.
Above $0.40, the chart places the 0.236 Fibonacci retracement near $0.4261. Reaching that level from $0.2644 would amount to a gain of roughly 61%.
The next heavier supply sits between $0.55 and $0.65. This zone overlaps the 0.382 Fibonacci level near $0.5969, making it a more difficult area for buyers to clear.
$ADA Higher Recovery Levels
If $ADA can eventually work through that supply, higher recovery levels appear at $0.7350, $0.8731, and $1.0696.
The larger retracement structure extends toward $1.32, followed by Fibonacci extensions at $1.6382 and $2.0431.
Those higher levels only become relevant if $ADA first repairs the structure closer to the current price.
What Happens if $ADA Loses $0.20?
The bearish scenario is more straightforward.
A weekly close below $0.20 would break the lower end of the historical floor and put the $0.14-$0.18 region back in focus.
A move below $0.14 would be more damaging. That would undercut the local-base scenario entirely and suggest that $ADA has not yet established a durable cycle floor.
For now, $ADA remains caught between a historical demand zone underneath and a multi-year lower-high structure overhead. The first bullish test is a reclaim of $0.32-$0.40. The first bearish warning is a weekly loss of $0.20.
As previously covered, Cardano founder Charles Hoskinson also reaacted to “$ADA Sleeping Giant Waking Up” remarks.

 thecryptobasic.com