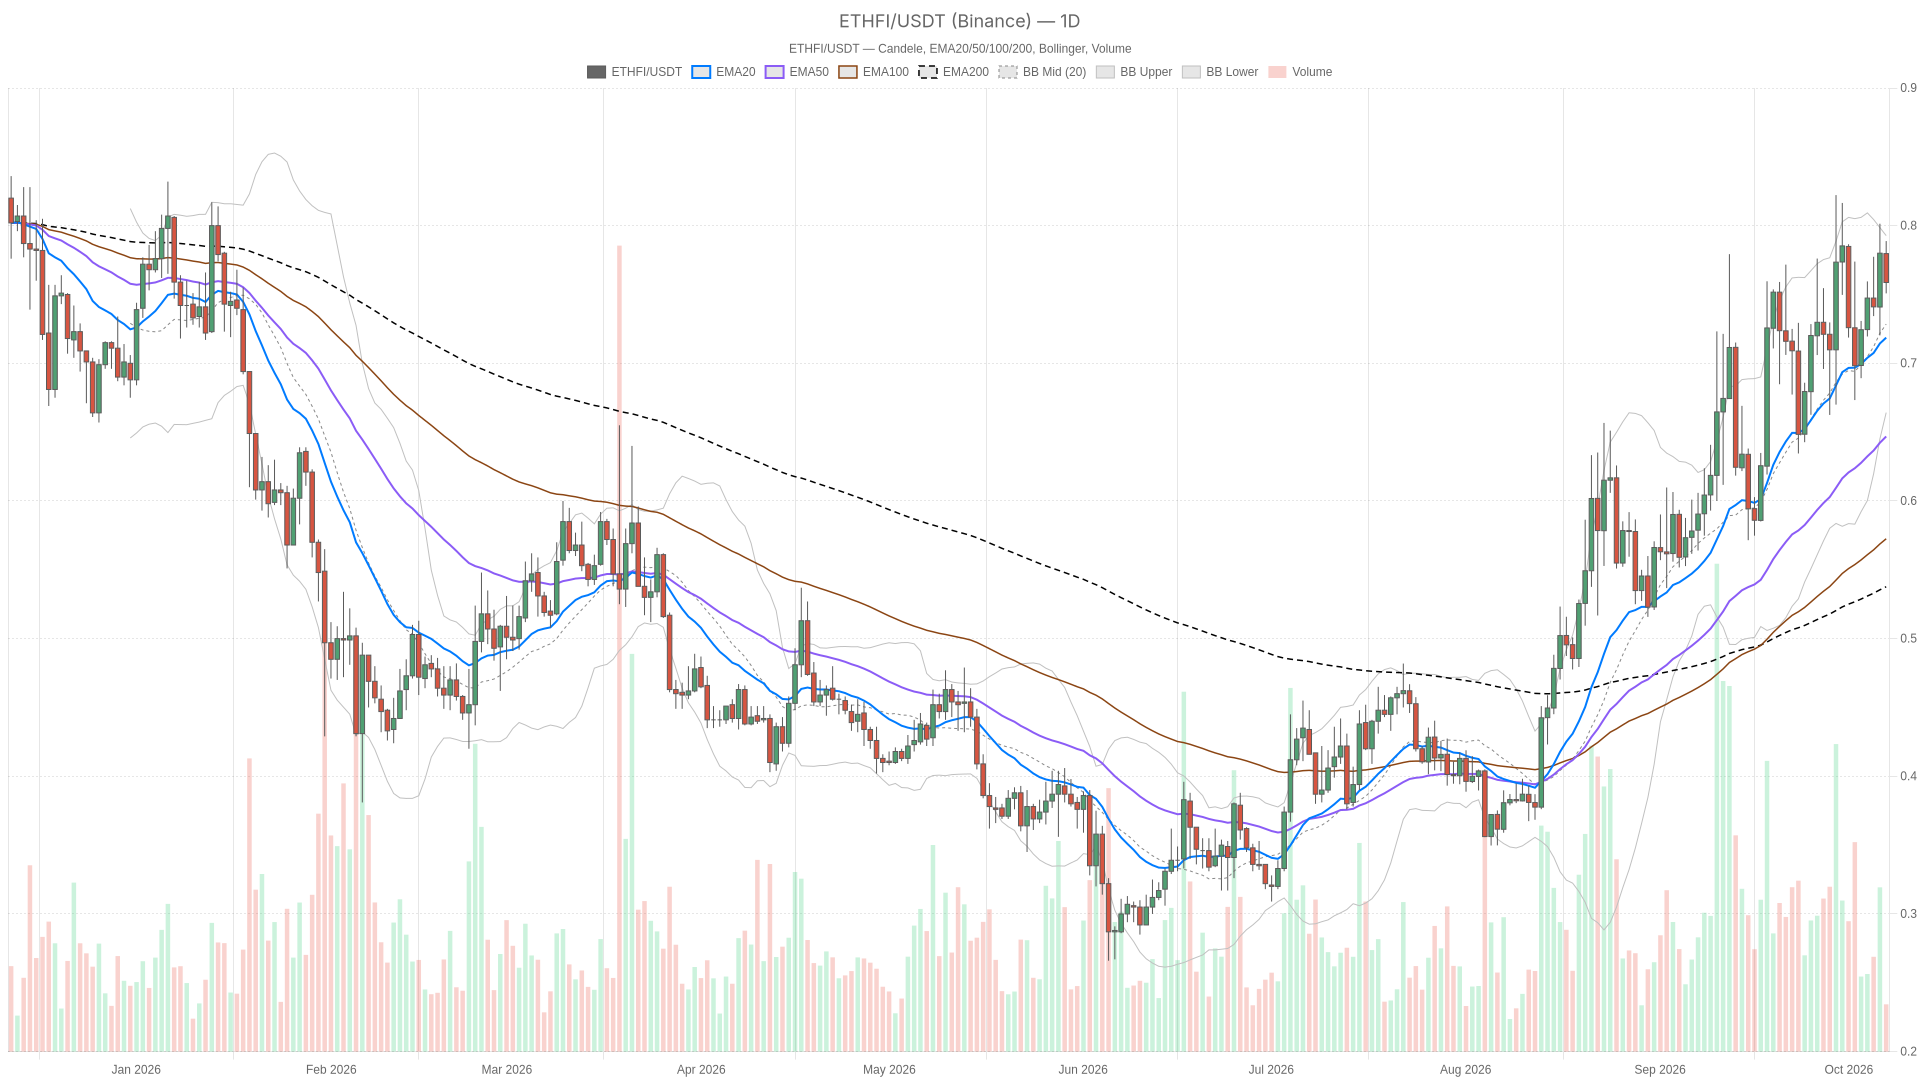
The tension matters because $ETHFI is pressing right into a cluster of overlapping levels — the daily pivot lines up with hourly moving averages just overhead — at the same time that hourly and 15-minute momentum readings have turned down. When structure says one thing and momentum says another, the honest read is that the market has not picked a direction yet, and the next few closes above or below that pivot cluster will likely decide which signal wins out.
Daily strength meets hourly hesitation around the EtherFi price
$ETHFI’s daily chart remains firmly bullish, but the hourly picture shows momentum cooling. On the daily timeframe, $ETHFI trades above its EMA20 ($0.7144), EMA50 ($0.6423) and EMA200 ($0.5355), with the EMAs themselves stacked in textbook bullish order. The daily RSI at 61.3 has been rising over the last three completed sessions, and the daily regime tag reads bullish.
Drop to the hourly chart and the picture gets murkier. Price is now below the hourly EMA20 ($0.7662) even though it still sits above the hourly EMA50 ($0.7561) and EMA200 ($0.7375) — the EMA order there is still bullish, but the pullback under the fastest average is a visible crack. The hourly RSI has fallen from 53.6 to 48.8 over the last three readings, and the hourly MACD histogram just flipped from positive to negative, crossing zero on the way down. Additionally, the 15-minute frame adds to the doubt: its EMA order is mixed, with price below EMA20 and EMA50 yet above EMA200, which simply means there is no coherent short-term trend to lean on right now, just noise around the pivot. In short, the daily trend structure is intact, but the hourly and 15-minute action is where the near-term risk is concentrated.
EMA stacking and Bollinger bands show a bullish daily frame cooling into chop
The daily Bollinger Bands confirm the bullish regime with price in the upper half of the range, while tighter hourly bands reflect the ongoing consolidation. The daily mid-band sits at $0.7218 and the upper band at $0.7986, with price trading in the upper half rather than near the floor. Daily ATR14 is $0.067, close to 9% of the current price, a reminder that swings of several cents in either direction are normal at this volatility level — not a signal on their own, just context for how wide the daily range can get.
On the hourly chart, the Bollinger mid-band ($0.7670) sits just above spot, with the bands themselves fairly tight — upper at $0.7998, lower at $0.7341 — and hourly ATR14 at $0.0152. This is a modest, unremarkable range that fits a market taking a breather rather than making a decisive move. The 15-minute bands are even tighter, with the mid at $0.7687, upper at $0.7880, lower at $0.7493, and ATR14 at $0.0082, consistent with the low-amplitude consolidation you would expect while the market waits to see whether the daily uptrend reasserts itself or the hourly pullback deepens.
RSI and MACD momentum readings pull in different directions
Momentum indicators are genuinely split by timeframe: the daily RSI is rising while the hourly RSI and MACD are fading, and none of the three timeframes agree with each other cleanly right now.
RSI: rising on the daily, fading on the shorter frames
The daily RSI at 61.3 is rising and still well short of overbought, which leaves room for further upside before momentum alone becomes a constraint. The hourly RSI at 48.8 has been falling for three straight readings — 53.6 to 53.0 to 48.8 — landing in neutral territory. It is not bearish, just drained of the push that was there a few hours ago. The 15-minute RSI at 39.8 has also been falling, from 42.7 to 41.6 to 39.8, and is approaching the oversold threshold without actually reaching it. A reading in the high 30s is not a reversal signal; it is just a tape that has been selling off into the base of its short-term range.
MACD: a daily histogram losing its bearish bite, an hourly histogram turning bearish
The daily MACD histogram is still negative at -0.0014, but it has been narrowing over the last three closes — -0.0035 to -0.0037 to -0.0014 — without crossing zero. In practice, the daily downside pressure that showed up a few sessions ago is fading, even if it has not flipped positive yet. The hourly histogram, however, tells the opposite story: it crossed from positive to negative over its last three readings and is now falling at -0.0014, which lines up with the drop in hourly RSI and is the clearest short-term bearish signal on the board. The 15-minute histogram, meanwhile, is negative at -0.0013 but narrowing, a mild conflict worth flagging: price and RSI are still soft on the smallest timeframe, but the momentum indicator there is quietly improving.
Key levels: a resistance cluster overhead and the bull/bear triggers
A tight resistance cluster sits just above spot at $0.7672, while support is concentrated around $0.7331. The daily pivot at $0.7672 coincides with both the hourly EMA20 ($0.7662) and the hourly Bollinger mid-band ($0.7670), forming that resistance cluster just above the current $0.7587 print. Above that, the daily Bollinger upper band sits at $0.7986 and the daily R1 at $0.8142. On the downside, the daily S1 at $0.7331 coincides with the hourly Bollinger lower band ($0.7341), creating a support cluster roughly 3% below spot; further down sit the daily Bollinger mid-band ($0.7218) and the daily EMA20 ($0.7144).
The bullish case needs a daily close back above the daily pivot at $0.7672, which would also clear the overlapping hourly EMA20 and Bollinger-mid resistance and open the path toward the daily Bollinger upper band at $0.7986 and daily R1 at $0.8142. That scenario would be invalidated by a daily close back below the daily S1 at $0.7331.
The bearish case centers on a daily close below that same daily S1 at $0.7331 — which would also break the coinciding hourly Bollinger lower band — exposing the daily Bollinger mid-band at $0.7218 and the daily EMA20 at $0.7144 as the next areas of interest. That case would be invalidated by a daily close reclaiming the $0.7672 pivot.
The likeliest false signal here is a quick intraday poke through the hourly pivot or hourly R1 ($0.7610–$0.7696) that does not hold: with the hourly regime neutral and the hourly MACD histogram freshly negative, a wick above that cluster without a daily close above $0.7672 would be consistent with the kind of fade you would expect while short-term momentum is still cooling.
Market backdrop: a Greed reading of 71 against a $2.88 trillion crypto market
Broader crypto sentiment remains in Greed territory at 71, even as the total market cap dipped 4.39% in the past 24 hours. The Fear & Greed Index from Alternative.me reads 71, pointing to a risk-on mood across crypto broadly even as $ETHFI itself digests its recent gains. Total crypto market capitalization stands at $2.88 trillion, down 4.39% over the past 24 hours according to CoinGecko, while Bitcoin dominance is at 58.76%. A market-wide pullback of that size alongside an elevated Greed reading is itself a tension worth noting — sentiment has not caught up with the day’s price action, and that gap can resolve in either direction for risk assets like $ETHFI.
FAQ
What is $ETHFI trading at right now?
$ETHFI trades at $0.7587 on Binance, down from the last completed daily close of $0.78.
Is $ETHFI bullish or bearish on the daily chart?
The daily regime is tagged bullish: price sits above the EMA20, EMA50 and EMA200, the EMA order is bullish, and the daily RSI at 61.3 has been rising over the last three sessions.
What would confirm a bullish continuation for $ETHFI?
A daily close above the daily pivot at $0.7672 would clear the overlapping hourly EMA20 and Bollinger-mid resistance and open the way toward the daily Bollinger upper band at $0.7986 and daily R1 at $0.8142.
What would signal a deeper correction?
A daily close below the daily S1 at $0.7331 — which coincides with the hourly Bollinger lower band — would expose the daily Bollinger mid-band at $0.7218 and the daily EMA20 at $0.7144.
Disclaimer: This article is for informational purposes only and does not constitute financial advice, an investment recommendation, or a solicitation to buy or sell any financial instrument or cryptocurrency. The analysis provided is not indicative of future results. Investing in crypto assets and financial markets carries a high risk of capital loss. Always do your own research (DYOR) and consult a qualified financial advisor before making any decision.
Article produced with the assistance of artificial intelligence and reviewed by the editorial team.

 en.cryptonomist.ch