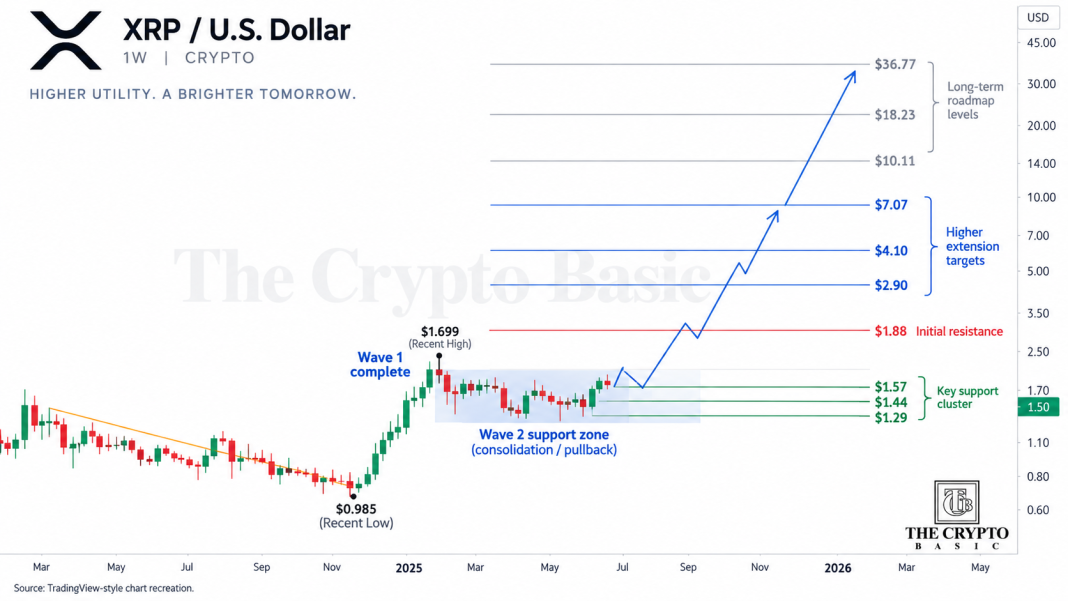
The chart does not show a specific exchange, but it is built on the $XRP/USD weekly timeframe. Its reference price stands at $1.4980, with a recent high near $1.6992 and a low around $0.9852.
$XRP Is Now Working Through Wave 2
The blue wave count shows the first advance already completed, followed by the current Wave 2 retracement.
That pullback is developing inside a broad support zone marked by Fibonacci levels at $1.5693, $1.4446, and $1.2939. $XRP is trading between the upper two levels, so the immediate question is whether buyers can keep price above the mid-$1.40s and prevent a deeper retracement toward $1.29.
The chart also shows a shaded historical zone across this region, suggesting sideways trade could continue before the next impulse begins.
A sustained break below $1.2939 would weaken the current wave count and force a reassessment of the bullish structure.
$1.88 and $2.90 Come Before the Bigger Move
Above current price, the first extension sits at $1.8815. $XRP would need to gain about 26% from $1.4980 to reach that level.
The next important extension appears at $2.9032, almost 94% above the current reference price.
Only after those levels are cleared does the projected Wave 3 advance begin to open toward $4.1046. From $1.4980, that would require roughly a 174% move.
The chart then places Wave 5 around $7.0790, representing an increase of about 373% from current price.
Higher Extensions Stretch Toward $36.76
Beyond the first five-wave sequence, the chart marks additional extension levels at $10.1106 and $18.2275, with a much larger projection at $36.7676.
Those distant levels are not the immediate setup. They depend on $XRP first holding the Wave 2 support zone and then successfully clearing the nearer resistance levels at $1.88, $2.90, $4.10 and $7.07.
For now, the next observable test is much closer: $XRP needs to hold above roughly $1.44 and begin pushing back through $1.57-$1.88 before the larger roadmap gains stronger technical support.

 thecryptobasic.com