As the market continues to recover, analyst Ali Martinez has mentioned three coins that could break out this week,
$XRP, Quant ($QNT), and Injective ($INJ): Notably, the three assets show different bullish structures, with $XRP testing a major triangle breakout level, Quant attempting to extend a historic monthly rally, and Injective retesting a cup and handle pattern.
$XRP Moves Above Descending Triangle
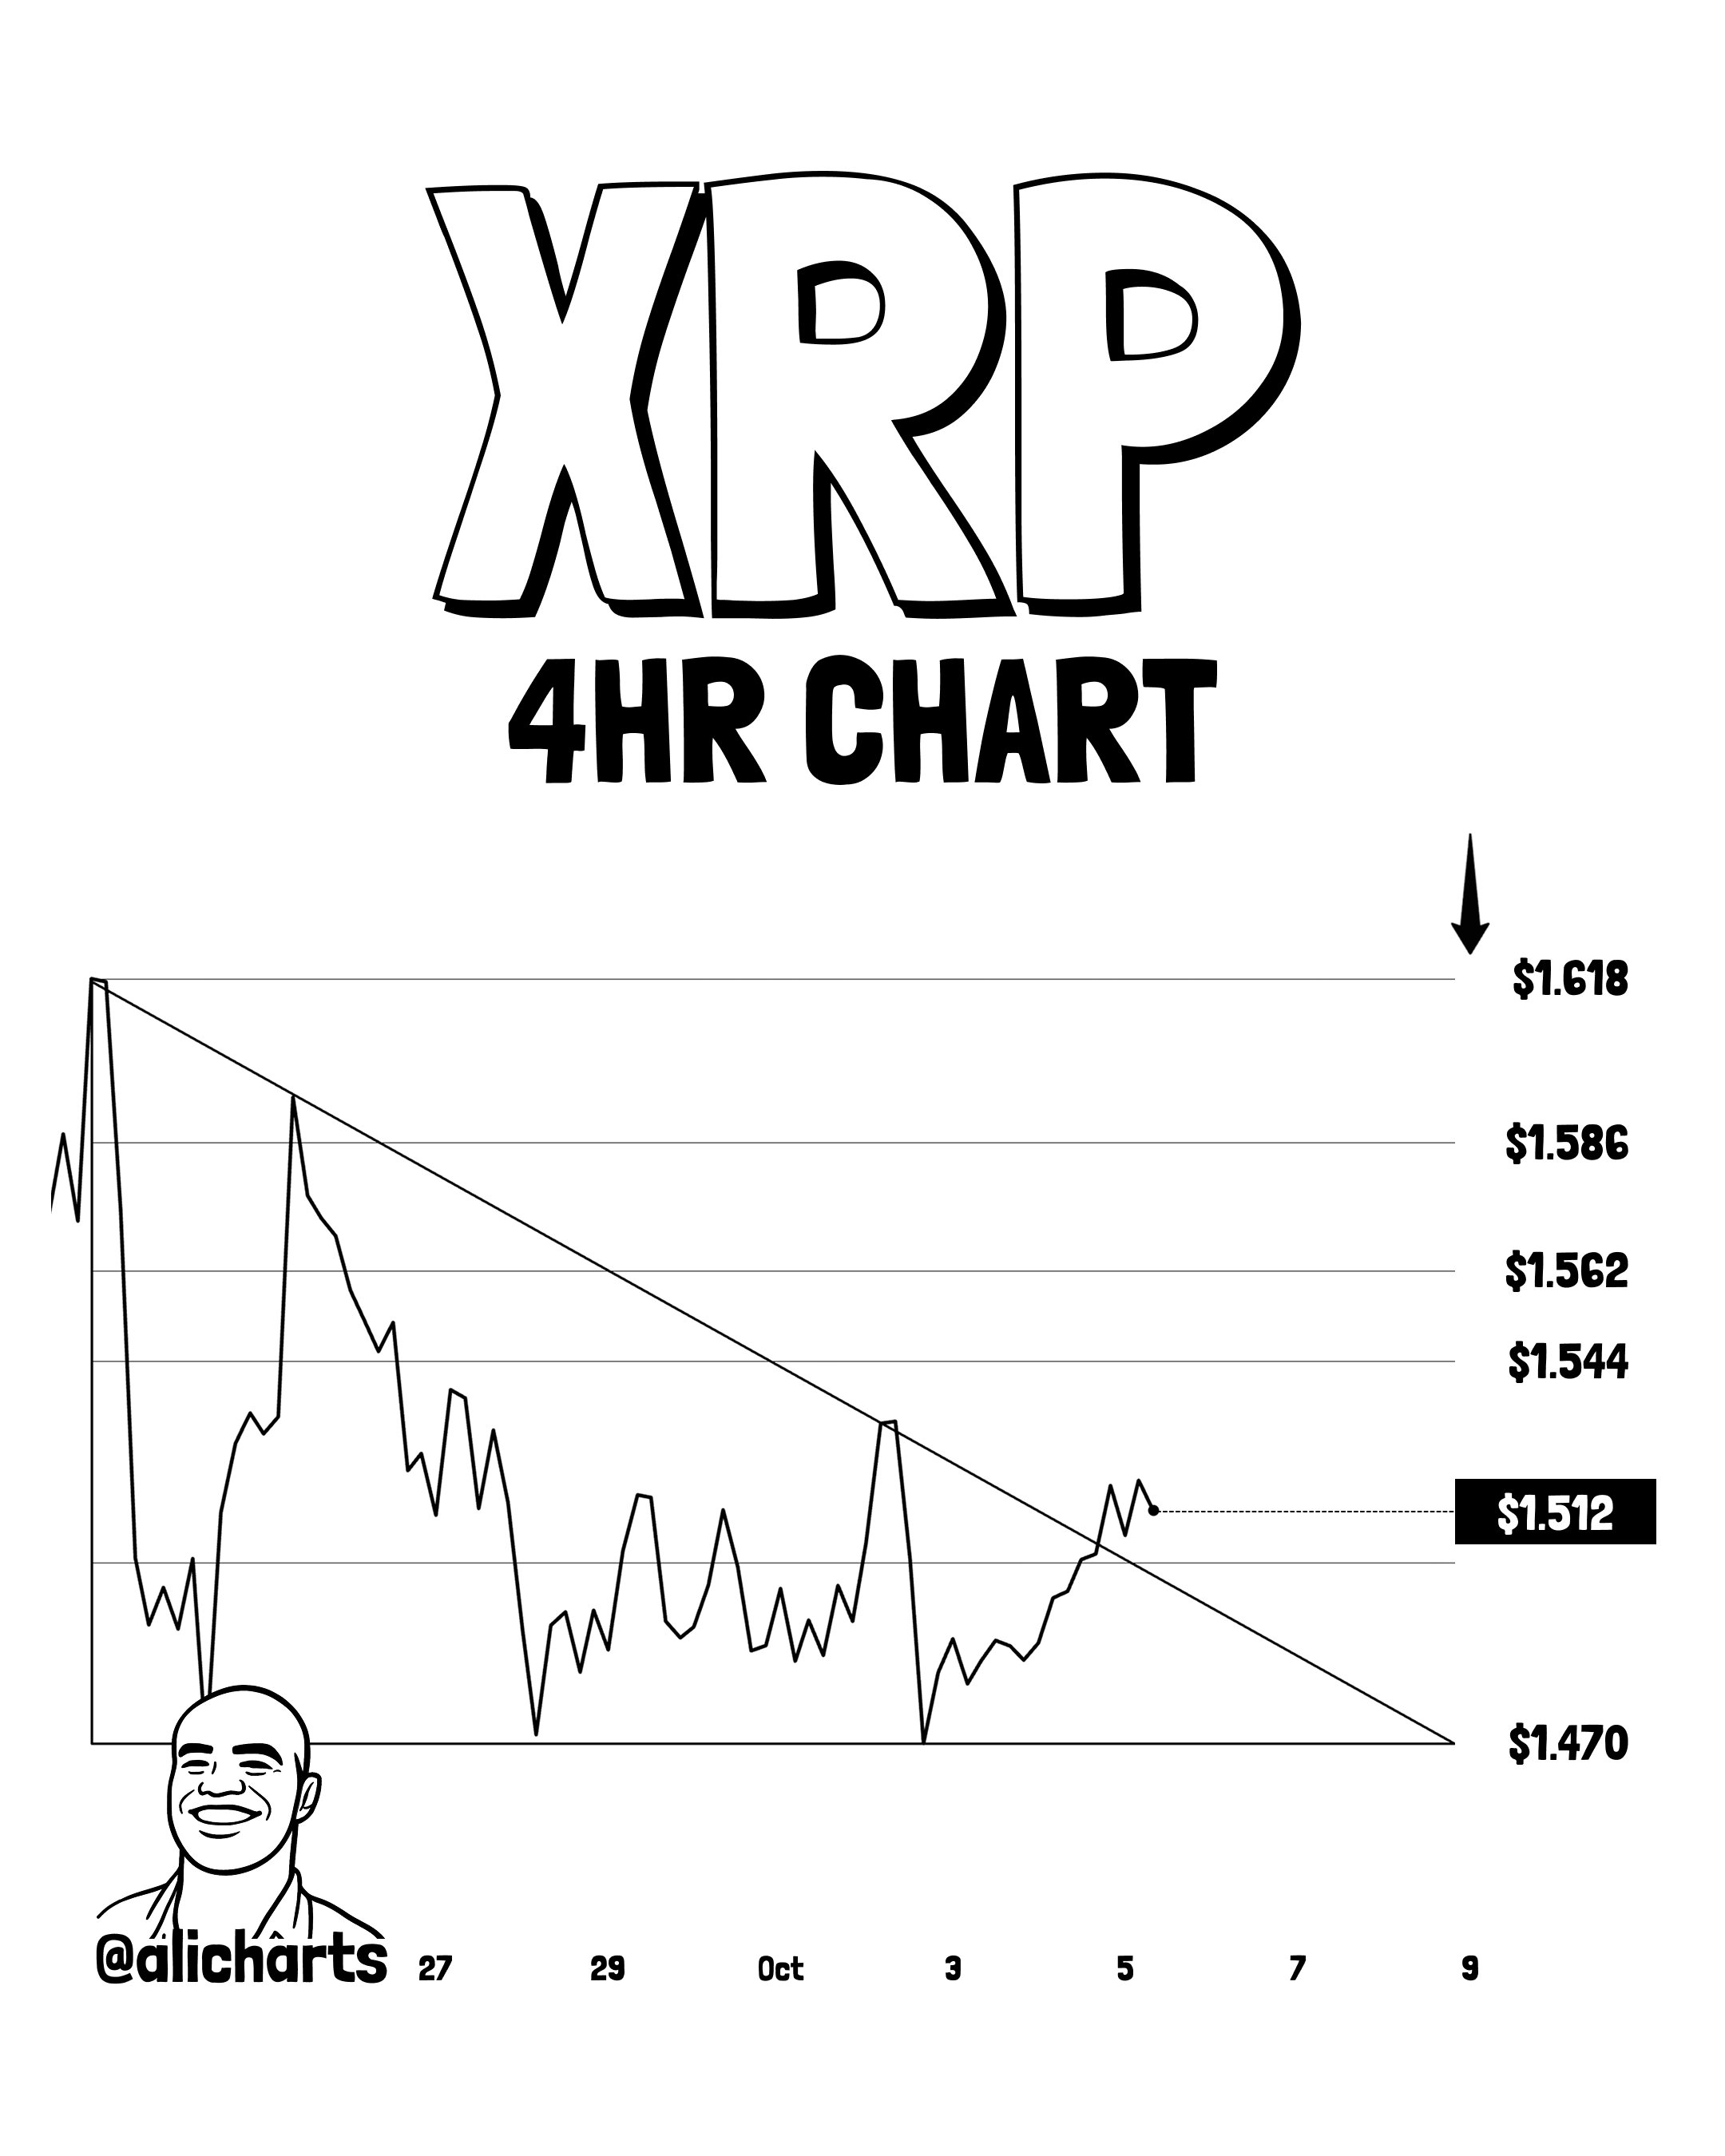
$XRP has moved above a key four-hour descending resistance line, with the next test being whether price can hold the breakout and turn former resistance into support.
Know when your coins move
Alerts, real-time prices, and market news — all in one app
Point your phone camera to install
4.8 based on 40K reviews in the App Store and Google Play
Chart data shows that$XRP entered the descending triangle after falling from $1.6569 on Sept. 23. The pattern developed as the price continued to move lower, with $XRP making two attempts to break above its upper resistance trendline.
The first attempt came on Sept. 25, when $XRP climbed to $1.6288. However, resistance at this level stopped the move and sent the price lower. $XRP later recovered and made another attempt, reaching $1.5533 on Oct. 2, but the resistance again forced a pullback.
$XRP 4h Chart | Source: Ali Martinez
The next recovery pushed $XRP back toward the upper resistance line. The price reached $1.49 on Oct. 4 and then broke above the trendline, taking $XRP out of the multi-week descending triangle. $XRP has since moved above $1.50 and currently trades at $1.5036.
A pullback could now send $XRP back to test the breakout level. The key point is whether $XRP can hold $1.50 as support during that retest. If the level holds, the next target could come at $1.62.
Quant Looks to Extend Its Huge September Gain
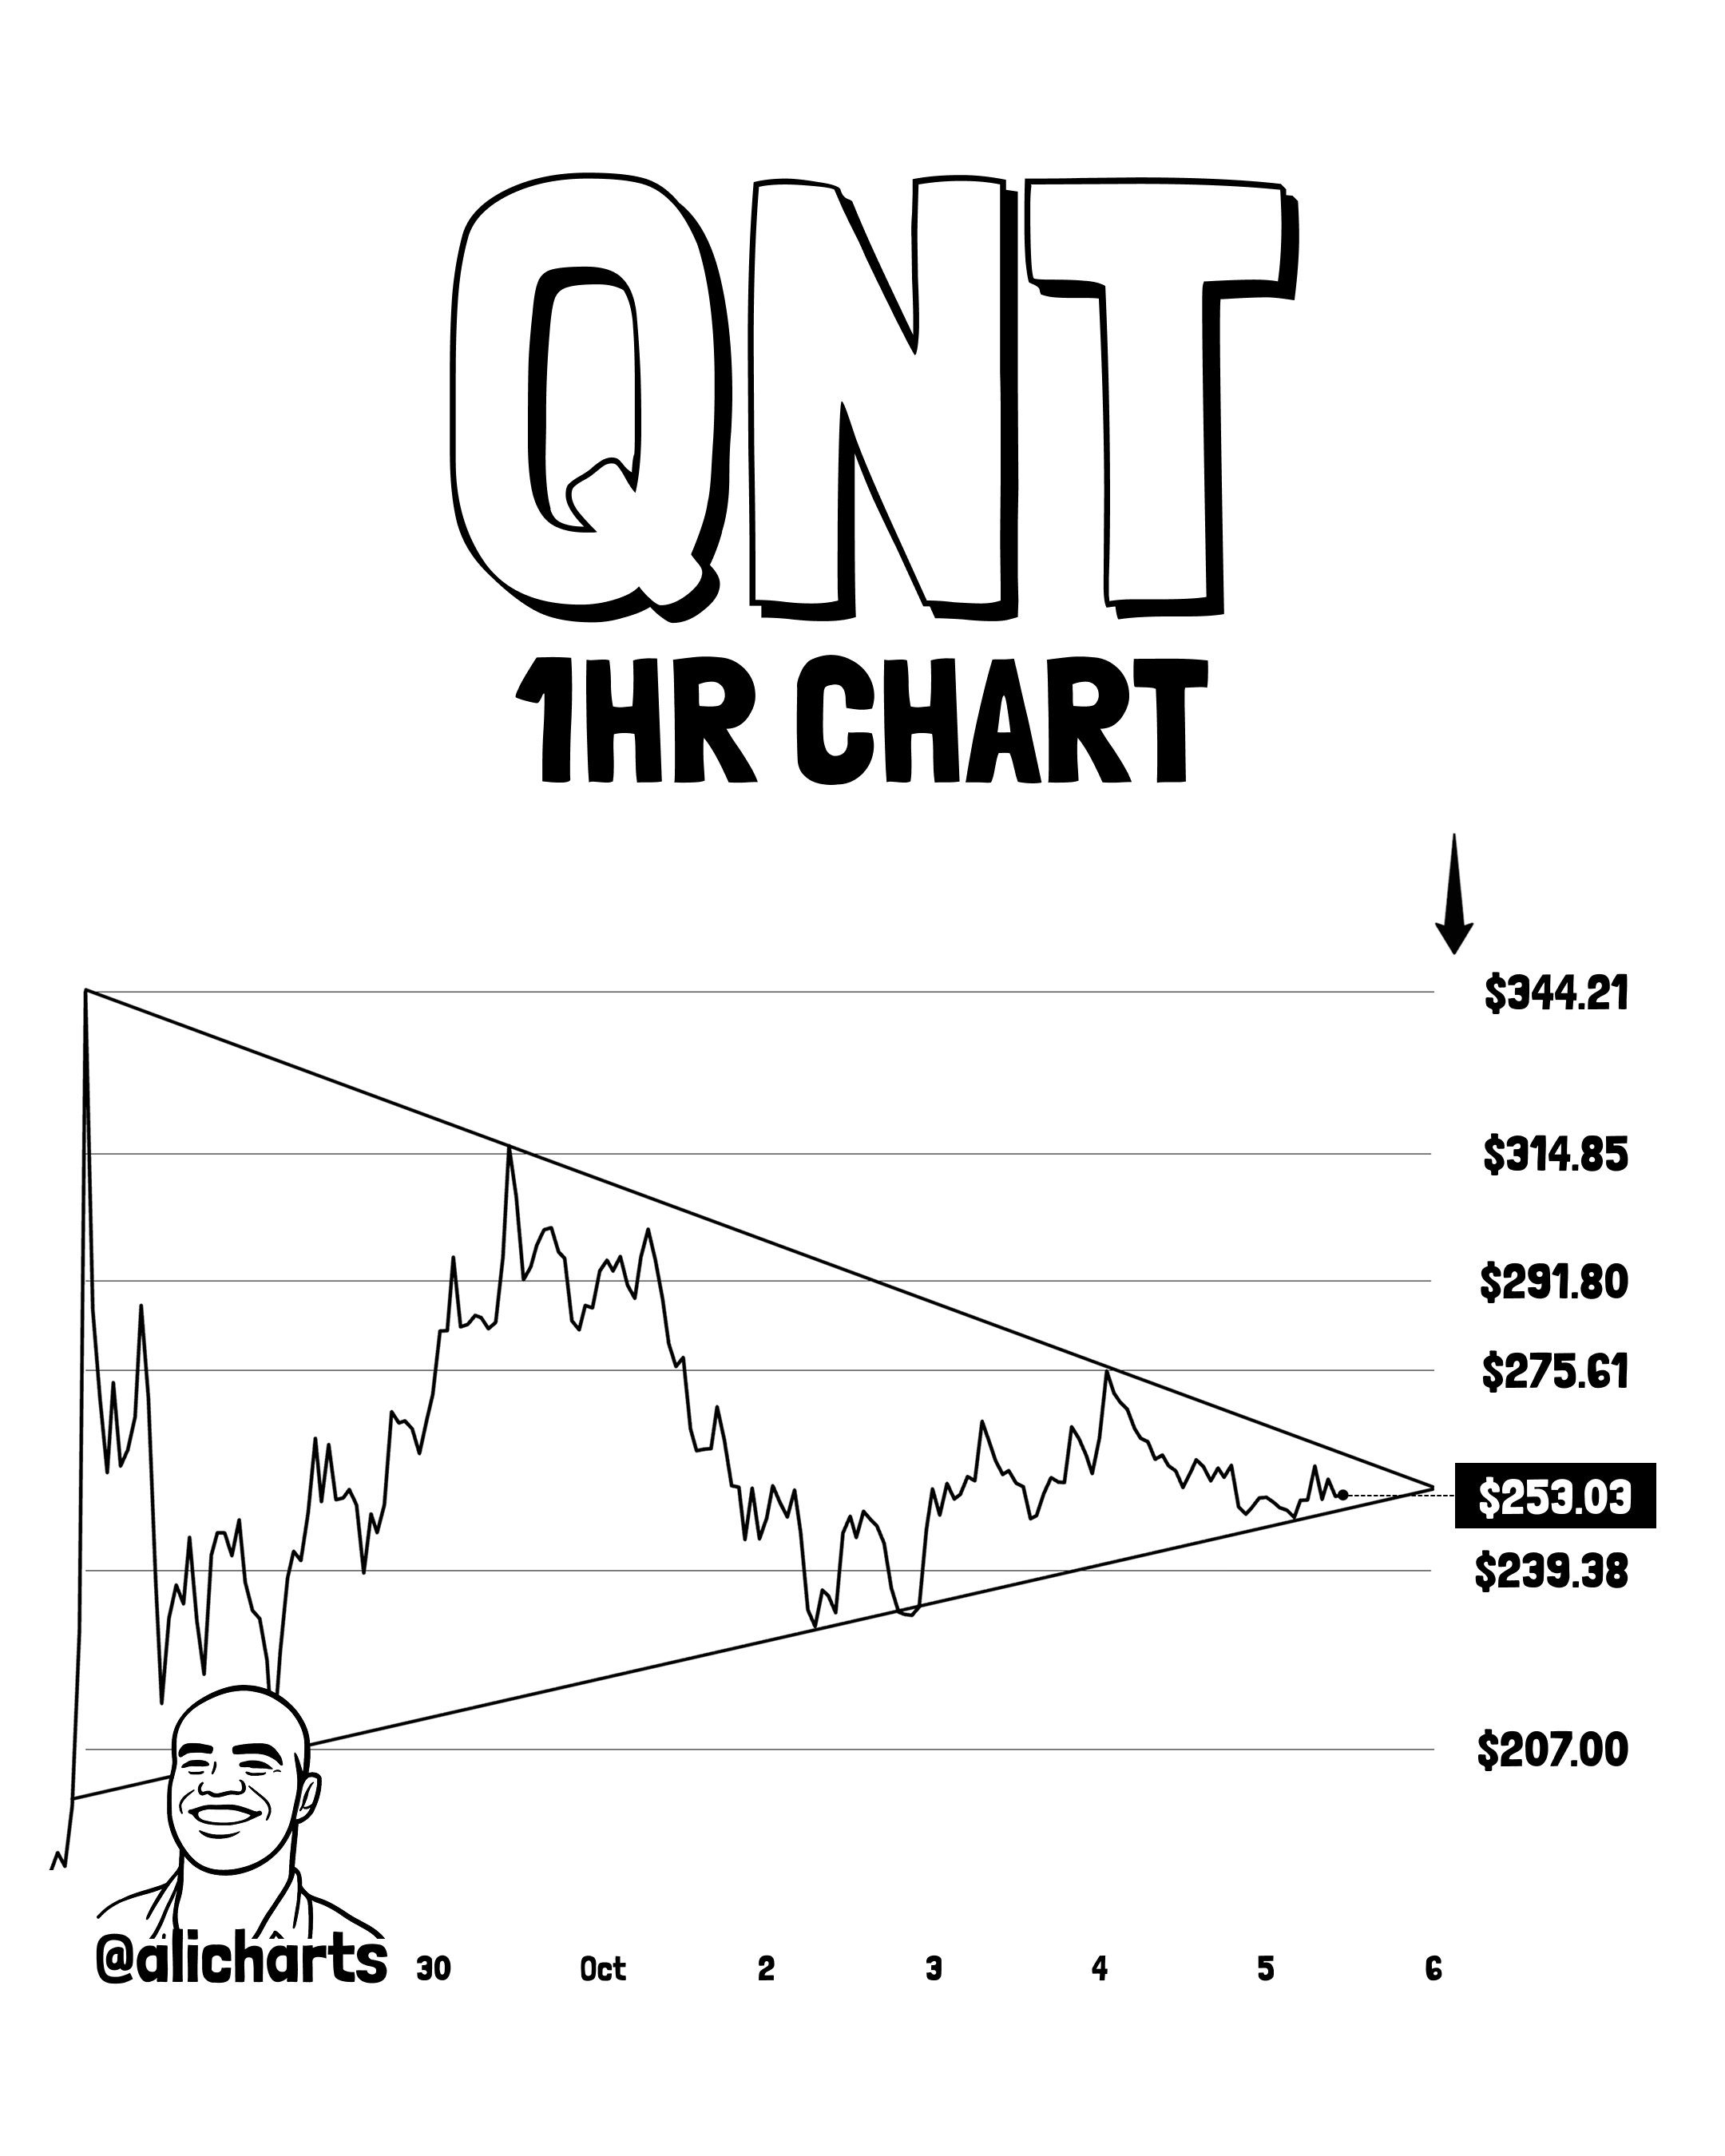
Quant also enters the week after a very strong September. Notably, $QNT jumped 369% last month, rising from $61.21 to $286.84. The move marked Quant’s strongest monthly gain on record, beating the previous 301% gain from June 2019.
$QNT has, however, started to give back some of those gains in October. The token is down 10.7% this month and currently trades at $256. The recent decline leaves the market watching to see whether Quant can regain its upward momentum.
Quant 1h Chart | Source: Ali Martinez
The $262 level is now the important level on the chart. An hourly close above $262 would confirm the breakout setup and could put $315 in focus. If the move continues, the next target would be $344.
Injective Retests Key $7.33 Level
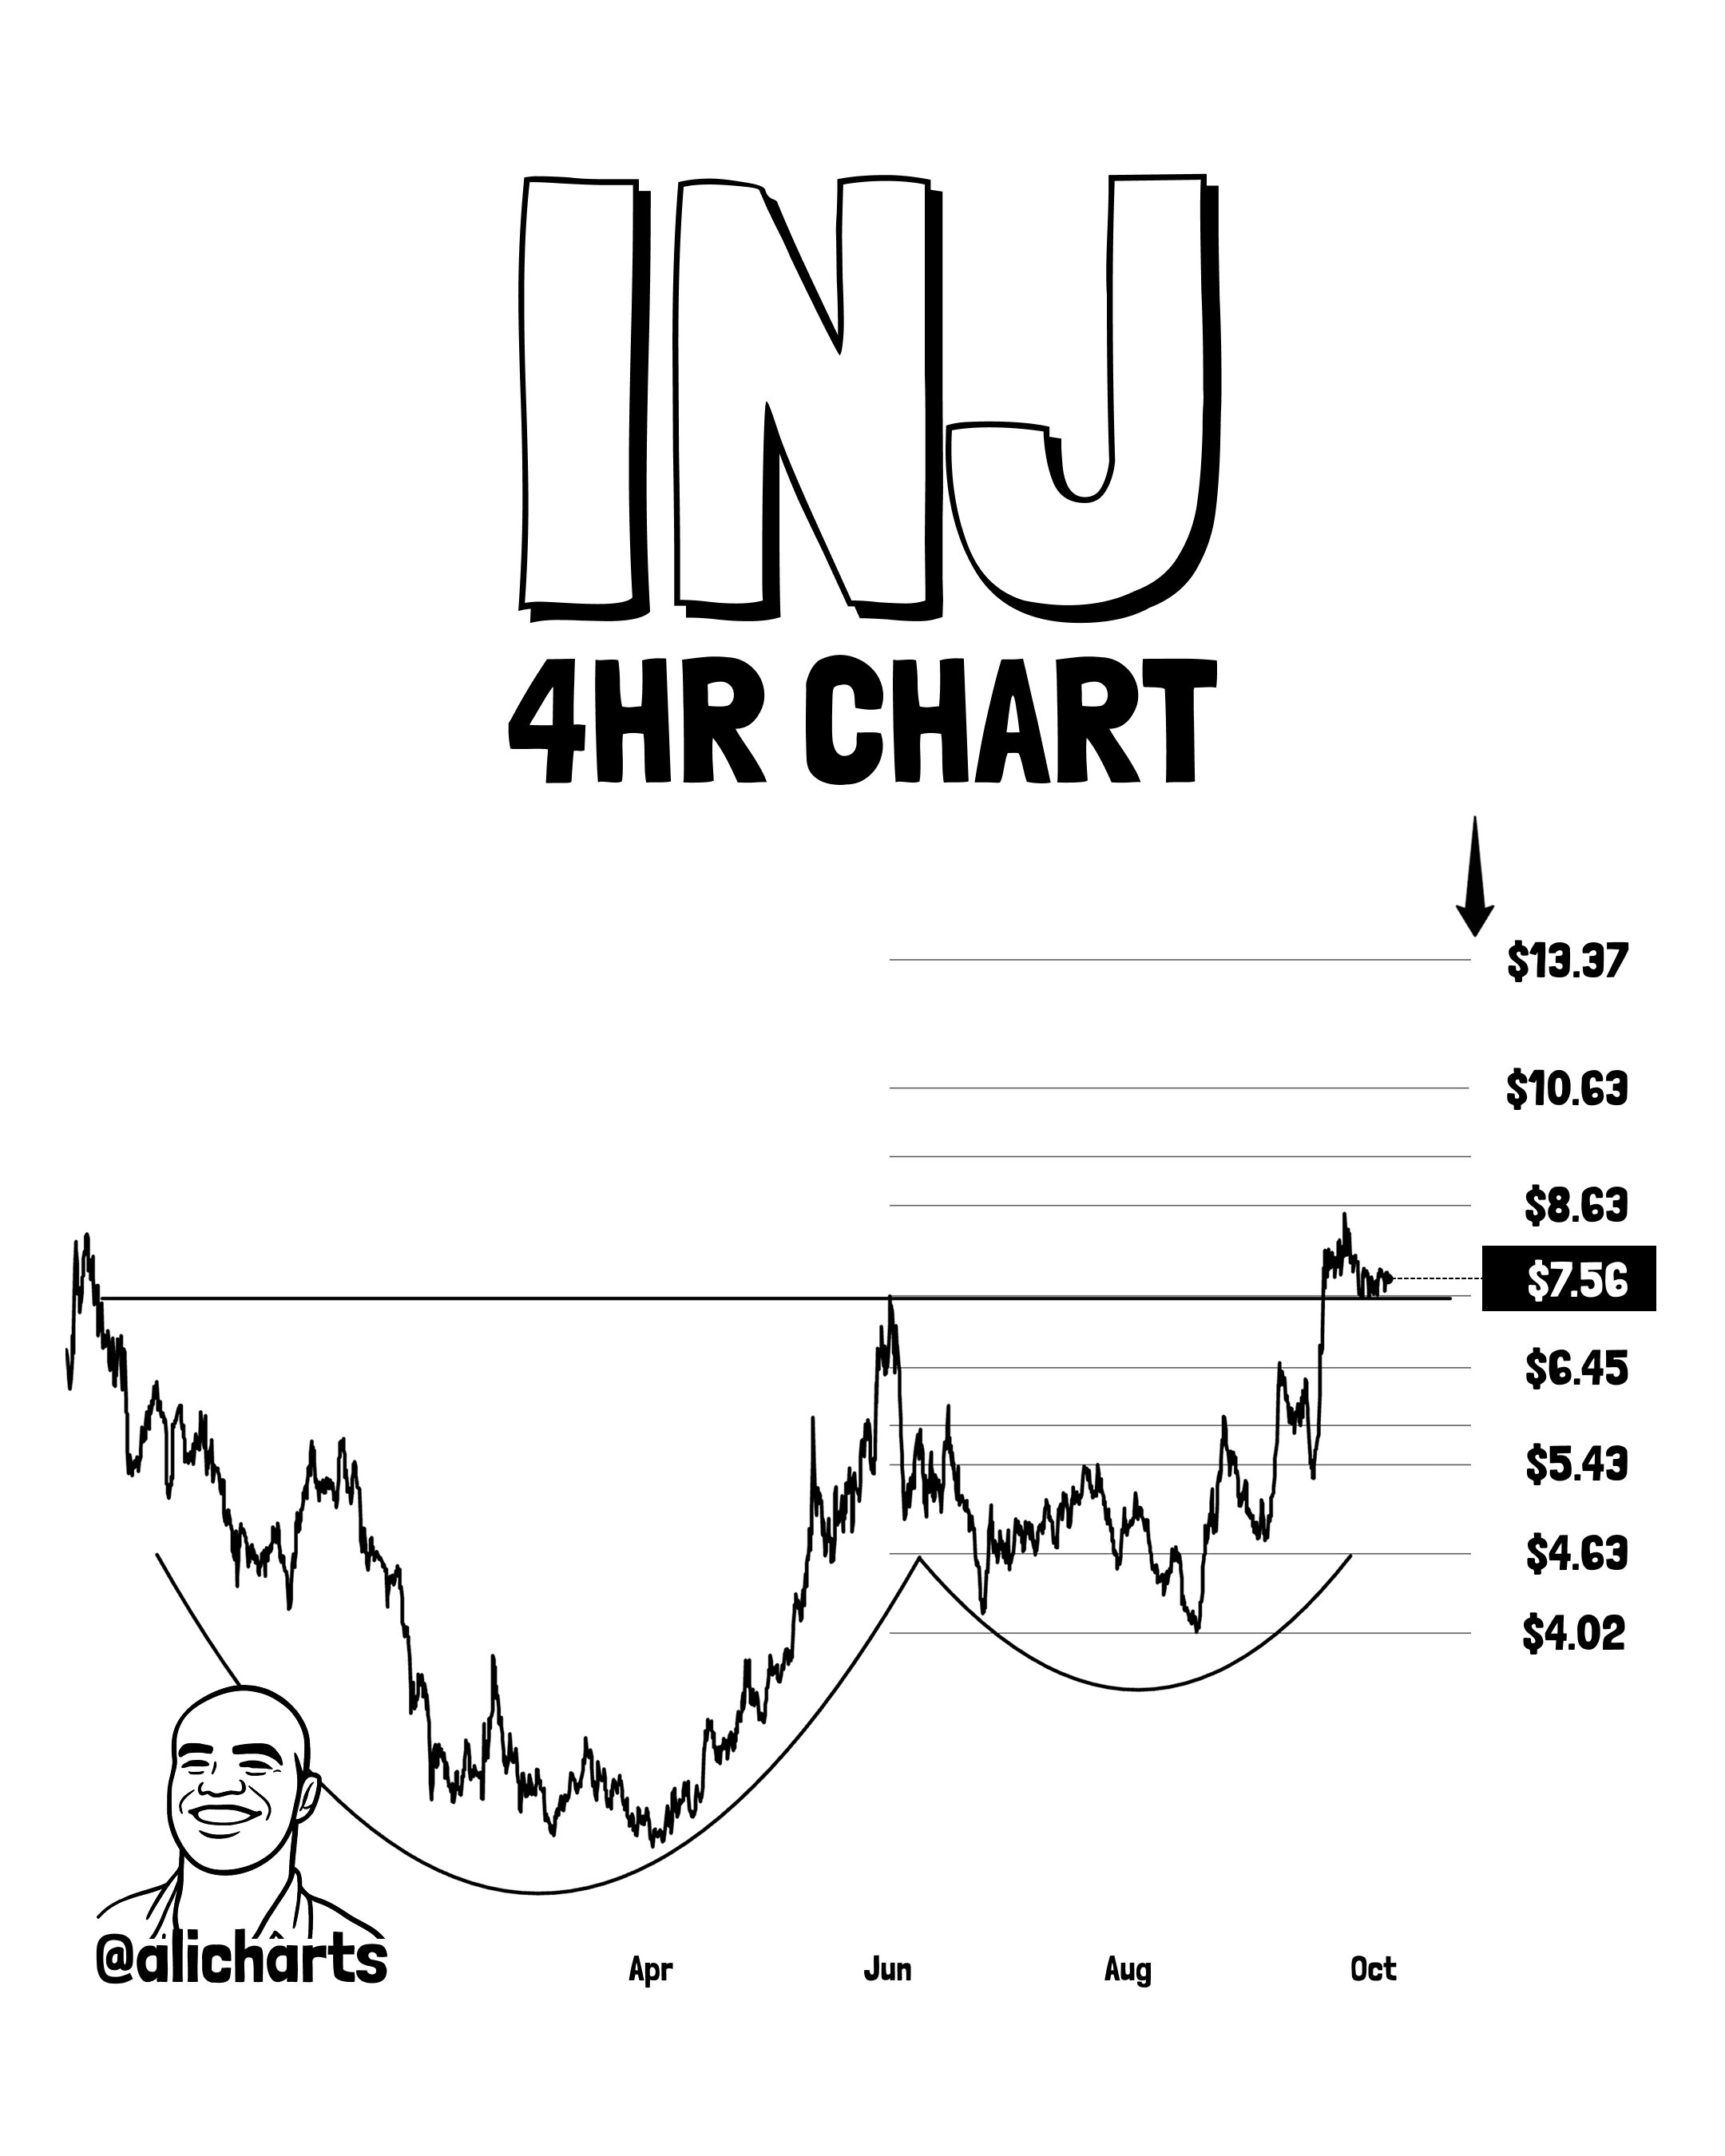
Injective has also produced a bullish setup after appearing to break out of a cup-and-handle pattern. $INJ is now retesting the neckline near $7.33, making that level important for the next move.
The cup started forming after Injective fell from $7.9 in November 2025. This decline continued until $INJ reached $2.7 in April 2026. The token then recovered and climbed to $7.2 by June 2026, completing the cup.
Injective 4h Chart | Source: Ali Martinez
Meanwhile, the handle formed as $INJ fell from the $7.2 high to lows around $3.9. The token then recovered and reached its current price of $7.5. The latest move has brought $INJ back toward the $7.33 neckline after the apparent breakout.
Buyers now need to defend $7.33 for the bullish setup to remain intact. If they hold the level and buying momentum increases, the pattern suggests a potential target of $13.40.

 thecryptobasic.com