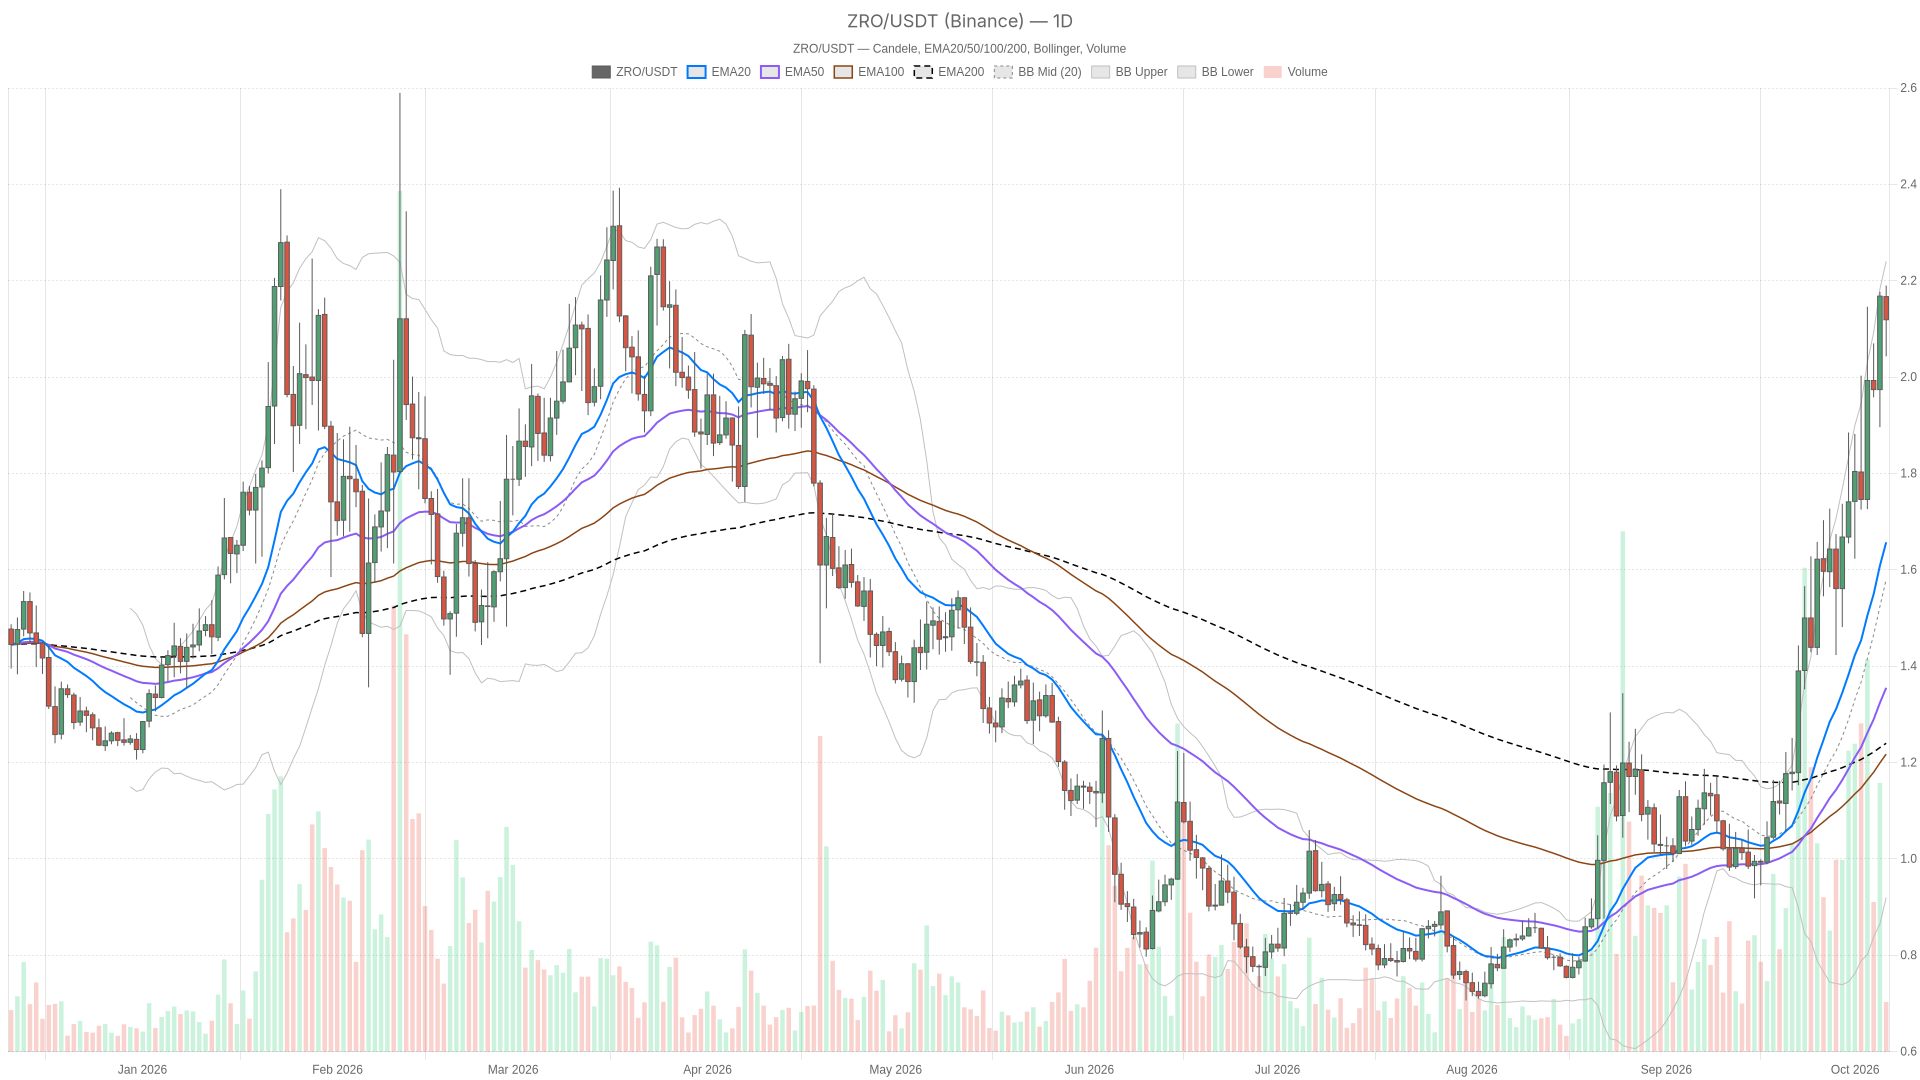
The dominant force on the daily chart is unmistakably trend-following. Price sits above the 20, 50 and 200-period EMAs, and the EMA order is bullish. The MACD histogram has been rising and widening across the last three closed candles. But an RSI near 81 is also a textbook setup for mean reversion. The shorter timeframes are already hinting at fatigue. On the hourly chart the price at $2.12 sits below the $2.15 close of the last completed hour, and on the 15-minute chart it trades below the $2.14 close that preceded it. That gap between daily conviction and short-term hesitation is the tension worth watching here.
Broader market context: Greed at 73 while the Layer Zero price holds near $2.12
Meanwhile, the total crypto market capitalization stands at $2.91 trillion, down 3.13% over the past 24 hours, according to CoinGecko. Bitcoin dominance sits at 59.19%. Against that backdrop, the Fear & Greed Index reads 73, classified as “Greed” by Alternative.me — a reading that sits a little awkwardly next to a broader market that just shed close to 3% of its total value in a day. For a token sitting this deep into overbought RSI territory, that mismatch between index-level greed and a softer broader tape is worth keeping in mind before leaning too hard on either signal alone.
EMA structure stays bullish, stacked on every timeframe, from daily to 15-minute
The EMA alignment is unambiguously constructive: $ZRO trades above every major average on every timeframe examined, and the 20-period sits above the 50-period which sits above the 200-period — the textbook definition of a trending market. On the daily chart, $ZRO trades above all three EMAs — the 20-period at $1.61, the 50-period at $1.32, and the 200-period at $1.23 — and the EMA order is bullish, meaning the 20 sits above the 50, which sits above the 200: the classic aligned uptrend structure. The same holds on the hourly chart, where price at $2.12 sits above the hourly EMA20 ($2.09), EMA50 ($2.03) and EMA200 ($1.86), again in bullish order. Even on the 15-minute chart the EMA order remains bullish, though price is essentially sitting right at the EMA20 ($2.12) rather than clearly above it, while still holding above the EMA50 ($2.11) and EMA200 ($2.03).
That consistency across three timeframes is meaningful: this is not a daily spike sitting on a weak short-term base; it is a structure that holds together top to bottom. The one asterisk is the 15-minute reading, where price touching rather than clearing its EMA20 shows the shortest-term trend has gone flat for now — consistent with a market pausing to digest the move rather than reversing it outright.
Daily RSI above 80 clashes with narrowing hourly MACD momentum
The daily RSI reads roughly 81 and has been rising over the last three closed candles (78.5, 77, 81) — momentum pushing higher rather than rolling over. The daily MACD histogram tells the same story: it printed 0.0466, 0.0465 and then 0.0548 across the last three completed candles, rising and widening, with the MACD line sitting well above its signal. That combination — stretched RSI alongside a still-expanding MACD — usually points to a trend that has not exhausted itself yet, even as pullback risk keeps building underneath it.
The picture softens on the hourly chart. RSI there sits at 61.4, comfortably short of overbought and still rising, but the MACD histogram has faded from 0.00457 to 0.00139 to 0.00159 over the last three closed hours — losing momentum and narrowing even though it remains positive. That is a stall, not a reversal, but it is exactly the kind of signal that tends to show up before a consolidation or a shallow pullback. On the 15-minute chart, the MACD histogram dipped negative before ticking back above zero, while RSI at 55.7 is mixed rather than trending — there is no strong short-term push in either direction, just noise around the middle of the range.
Bollinger Bands reinforce the stretched-but-not-broken read on the daily chart: the upper band sits at $2.18, almost exactly where price is trading, with the mid band all the way down at $1.52. Daily ATR near $0.19 shows the kind of range expansion you would expect from a move this extended, keeping $ZRO pinned near the top of its own daily volatility envelope. The hourly bands are far tighter (mid $2.08, upper $2.21, ATR around $0.053), and the 15-minute bands are tighter still (mid $2.13, upper $2.15, ATR of roughly $0.025), which fits a market catching its breath intraday while the daily trend keeps running hot.
$2.13 hourly pivot separates continuation from a pullback toward $1.98
On the daily chart, resistance sits at the Bollinger upper band ($2.18) and daily R1 ($2.26), while support comes in at the daily pivot ($2.08), daily S1 ($1.98), and further below at the daily EMA20 ($1.61) and EMA50 ($1.32) — though those averages sit far enough under current price to act as a macro floor rather than an immediate reference. The daily pivot at $2.08 coincides with the hourly Bollinger mid, which gives that level some extra weight as a dividing line between the current uptrend and a deeper correction. On the hourly chart, the nearer resistance is the hourly pivot at $2.13 — a level price is currently trading just under — followed by hourly R1 at $2.17 and the hourly Bollinger upper at $2.21. Hourly support sits at $2.11 (S1), then the hourly EMA20 at $2.09.
The bullish case needs an hourly close above the hourly pivot at $2.13, followed through by a daily close above the daily Bollinger upper at $2.18, which would open the way toward daily R1 at $2.26. That combination would confirm the daily uptrend is absorbing the overbought RSI reading rather than giving way to it. This scenario would be invalidated by a daily close back below the daily pivot at $2.08 — a break there would suggest the stretched RSI is finally catching up with price.
The bearish case flips that logic: a daily close below the daily pivot at $2.08 would open a corrective leg toward daily S1 at $1.98, consistent with an RSI reading this extended finally mean-reverting. That pullback thesis would be invalidated by an hourly close back above the hourly pivot at $2.13, which would put $ZRO back in control of its short-term range and point momentum back toward the daily highs.
The likeliest false signal here is a quick move through the hourly pivot or hourly R1 that does not hold on a daily close — given how tight the 15-minute range has become, with ATR of just around $0.025, a brief wick through either level on thin conviction would not by itself confirm either scenario.
FAQ
Is $ZRO’s daily RSI overbought right now?
Yes. The daily RSI14 reads roughly 81, above the 70 threshold that defines overbought conditions, and it has been rising over the last three closed candles.
What is the main resistance above the current price?
On the daily chart, resistance sits at the Bollinger upper band near $2.18 and daily R1 at $2.26. On the hourly chart, the nearer resistance is the hourly pivot at $2.13.
What would confirm the bullish scenario for $ZRO?
An hourly close above the hourly pivot at $2.13, followed by a daily close above the daily Bollinger upper band at $2.18, which would open the way toward daily R1 at $2.26.
What would trigger a bearish correction?
A daily close below the daily pivot at $2.08 — the level that coincides with the hourly Bollinger mid — would open a corrective move toward daily S1 at $1.98.
Disclaimer: This article is for informational purposes only and does not constitute financial advice, an investment recommendation, or a solicitation to buy or sell any financial instrument or cryptocurrency. The analysis provided is not indicative of future results. Investing in crypto assets and financial markets carries a high risk of capital loss. Always do your own research (DYOR) and consult a qualified financial advisor before making any decision.
Article produced with the assistance of artificial intelligence and reviewed by the editorial team.

 en.cryptonomist.ch