Market backdrop stays shaky while Starknet chain activity accelerates
The broader market isn’t offering much of a tailwind. Total crypto market capitalization stands at $2.89 trillion, down 2.79% over the past 24 hours according to CoinGecko, while Bitcoin dominance sits at 59.08%. The Fear & Greed Index reads 65, classified as “Greed” by Alternative.me — a level consistent with traders still willing to chase upside even as aggregate market value slips.
On the Starknet chain itself, DefiLlama data puts total DEX trading volume over the past 24 hours at $25.66 million. That figure spans the whole chain’s top venues and isn’t a direct read on $STRK demand specifically.
The moves, however, are notable: Ekubo’s volume is up 173.31% in a day, 378.7% over seven days and 393.55% over 30 days. Nostra Pools shows even sharper swings of 271.66% daily, 565.19% weekly and 268.37% monthly. Both venues point in the same direction, which suggests the chain is seeing heavier turnover alongside the token’s price move, even if it can’t be read as $STRK-specific flow.
EMA structure is clean on the hourly chart, messier on the daily
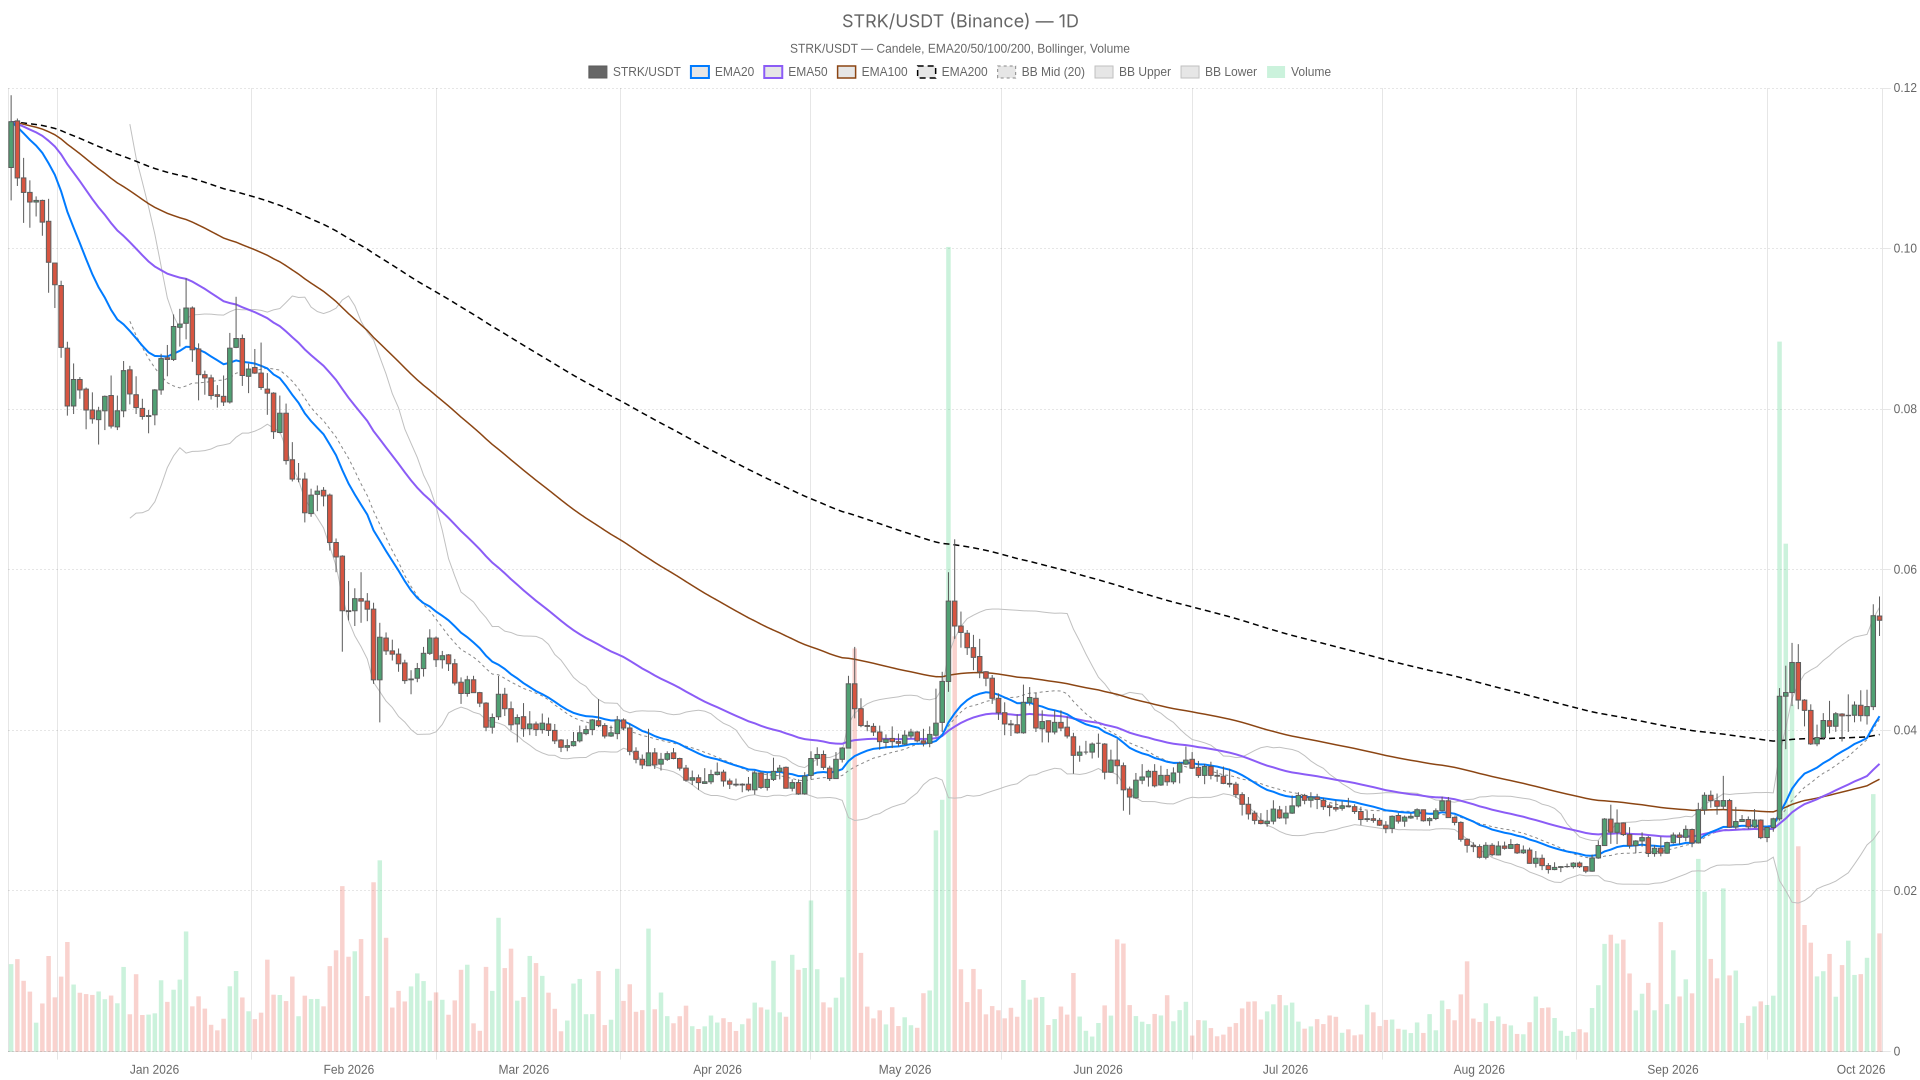
The Starknet price sits above every EMA on all three timeframes, but the quality of that structure differs by timeframe. On the daily chart, price is above EMA20 ($0.04051), EMA50 ($0.03510) and EMA200 ($0.03934), yet the EMA order itself is mixed — EMA50 sits below EMA200 rather than above it.
That mismatch is why the system’s daily regime read comes back as neutral despite the overbought RSI and the fresh MACD cross. It usually shows up when a rally moves quickly enough that the medium-term average hasn’t caught up to the longer-term one yet, rather than building through a slow grind.
The hourly chart tells a cleaner story: price above EMA20 ($0.05143), EMA50 ($0.04797) and EMA200 ($0.04398), with the averages themselves stacked in textbook bullish order. The 15-minute frame complicates things only at the margin — price has slipped just under its own EMA20 ($0.05390) while holding above EMA50 ($0.05275) and EMA200 ($0.04803), with that EMA stack also bullish. In practice, the short-term dip looks like a pause inside an intact uptrend rather than a break in structure, at least for now.
Daily and hourly RSI near 75 sit against a flattening 15-minute MACD
Daily RSI is at 74.6, up from 60.2 and 62.0 over the prior two completed sessions — solidly overbought and still climbing. The daily MACD histogram just crossed into positive territory after two negative readings, which lines up with the RSI move and confirms there’s real momentum behind this leg, at least on the daily timeframe.
The catch is the Bollinger setup: the last completed daily candle closed at $0.05428, above the upper band at $0.05391, and price has since eased back to $0.05372. An overshoot like that, followed by an immediate pullback, is often a sign that a move needs to cool off before it can extend further. Daily ATR sits near $0.004625, roughly 8.6% of the current price — a wide range that fits an asset in an active expansion phase.
Hourly RSI is at 76.6, also overbought, and it has been rising over its last three readings (70.8, 70.8, 76.6). The hourly MACD histogram has crossed zero too, but the print is tiny — the kind of reading that confirms direction without much conviction behind it. Hourly ATR is around $0.0018, about 3.3% of price.
The 15-minute chart is where the picture diverges. RSI there has slipped to 62.3 after falling from 69.3 to 62.9 to 62.3 over the last three completed candles — momentum fading on the execution timeframe even as the daily and hourly readings sit deep in overbought territory. The 15-minute MACD histogram is essentially flat, holding near a small positive value without a clear directional push, and the 15-minute ATR of roughly $0.0009687 is a far tighter range than the daily or hourly figures. This is the central tension: the bigger trend looks stretched and strong, while the smallest timeframe is already hesitating.
The Starknet price faces its daily Bollinger extreme and a tight hourly resistance cluster
On the daily chart, $STRK has already closed one session above the upper Bollinger Band at $0.05391 before slipping back toward $0.05372. The next level above is the daily R1 at $0.05915. Below current price, the daily pivot at $0.05084 is the first cushion, with the daily S1 at $0.04597 and the daily EMA20 near $0.04051 as deeper supports should the pullback extend.
The hourly chart shows a tighter cluster just overhead: the hourly S1 at $0.05373 sits just above spot and acts as the first resistance, followed by the hourly pivot at $0.05521 and the hourly R1 at $0.05712. On the downside, the hourly EMA20 at $0.05143 — which lines up closely with the hourly Bollinger mid at $0.05137 — is the first support, with the hourly EMA50 at $0.04797 further below.
Bullish scenario: An hourly close back above the hourly pivot at $0.05521, followed by a push through the hourly R1 at $0.05712, would support a move toward the daily R1 at $0.05915. That path needs the overbought daily and hourly RSI readings to keep climbing rather than roll over, which isn’t guaranteed given the fading momentum already visible on the 15-minute chart. Invalidation would come from a daily close back below the daily pivot at $0.05084, which would point to a deeper retracement.
Bearish scenario: An hourly close below the hourly EMA20 at $0.05143 would signal the intraday structure is cracking, opening room toward the hourly EMA50 at $0.04797 and, on the daily chart, the daily S1 at $0.04597. This scenario would be undercut by a daily close that reclaims the daily Bollinger upper band near $0.05391, which would suggest the pullback was shallow and buyers remained in control.
Given overbought readings on both higher timeframes next to cooling 15-minute momentum, the most likely false signal here runs in either direction. A brief dip gets mistaken for a reversal when it’s just the stretched daily and hourly trend catching its breath. Alternatively, a bounce off hourly support gets read as fresh strength when RSI at these levels still has plenty of room to unwind without the broader EMA structure actually breaking.
FAQ
What is the Starknet price right now?
$STRK trades at $0.05372 on Binance, off the last completed daily close of $0.05428.
Is $STRK overbought on the daily chart?
Yes. Daily RSI stands at 74.6, up from 60.2 and 62.0 over the previous two completed sessions, placing it firmly in overbought territory.
What would confirm further upside for $STRK?
An hourly close above the hourly pivot at $0.05521 and then the hourly R1 at $0.05712 would support a move toward the daily R1 at $0.05915.
What would signal the rally is losing steam?
An hourly close below the hourly EMA20 at $0.05143 would point to a deeper pullback toward the hourly EMA50 at $0.04797 and the daily S1 at $0.04597.
Disclaimer: This article is for informational purposes only and does not constitute financial advice, an investment recommendation, or a solicitation to buy or sell any financial instrument or cryptocurrency. The analysis provided is not indicative of future results. Investing in crypto assets and financial markets carries a high risk of capital loss. Always do your own research (DYOR) and consult a qualified financial advisor before making any decision.
Article produced with the assistance of artificial intelligence and reviewed by the editorial team.

 en.cryptonomist.ch