OriginTrail’s holder count surges to 27,060 ATH – Here’s what it means for TRAC
ambcrypto.com
2 h
OriginTrail [$TRAC] has maintained a bullish outlook, posting a 27% gain in the last 24 hours as bulls dominate market activity.
However, market overvaluation now threatens the bullish outlook and could increase the risk of a decline. Other insights into what’s happening across the asset still hold the potential for the rally to continue and for the market to surge further.
$TRAC’s rally shows early signs of a reversal
Chart analysis using technical indicator tools has mapped a path for $TRAC, and this time, it’s a road that leads to a decline eventually.
Know when your coins move
Alerts, real-time prices, and market news — all in one app
4.8 based on 40K reviews in the App Store and Google Play
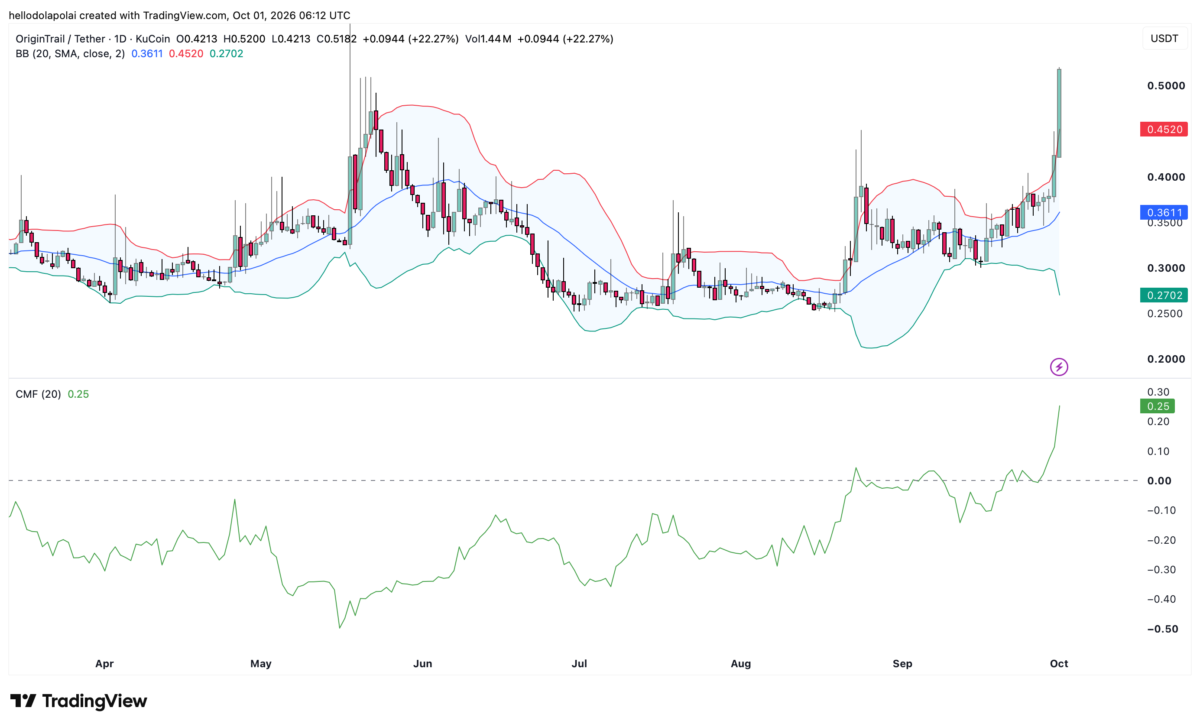
The Bollinger Band assesses whether the market is overvalued or undervalued based on price position. The upper band marks overvaluation, while the lower band marks undervaluation. The indicator now points to a potential decline for $TRAC.
The decline is based on the fact that the price has rallied into the upper boundary, and this simply implies there’s likely to be selling pressure that weighs on price, as it historically does, leading to a decline.
One important note is that the Bollinger Band is more of a warning indicator of a possible decline and doesn’t imply that an asset will see an immediate fall. Other factors come into play for the decline to eventually happen.
Source: TradingView
For now, there’s a high chance that the rally could still hold in the short term, based on the analysis of the Chaikin Money Flow Indicator.
This indicator is used to assess whether there’s buying or selling volume in the market. Based on the reading in the positive region, it suggests there’s been more buying volume.
Right now, that volume is at one of its highest levels, a level, in fact, last seen around the fourth quarter of 2024.
That being the case, there’s a high chance that the price could still witness further upward movement, though the Bollinger Band marks the asset as overvalued.
What to expect is that $TRAC is likely to see a further surge before it begins its reversal move eventually.
Rising holders and sentiment support the rally
There’s been a surge in the holder count that supports the bullish narrative, implying that new investors are entering the market.
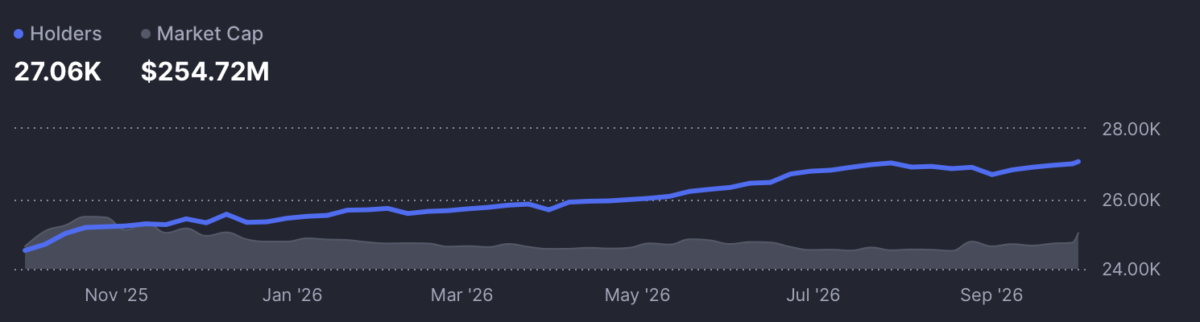
CoinMarketCap’s Token Holders Count, which tracks on-chain holdings, shows that a total of 27,060 holders are now in the market, a new all-time high reached in the last 24 hours.
Between the 25th of September and press time, that number grew by just 130 holders, 60 of which came in the past day.
Source: CoinMarketCap
This surge in holders translates to growing conviction in an asset’s performance, especially in the near term. What adds more to this is the sentiment in the market staying positively high.
CoinMarketCap noted that the sentiment hit 4.00 in the past day, which, when compared to the scale of -10 to 10, is in a region that bulls can defend.
Sentiment as high as this suggests investors are likely to channel more capital into the asset, buying at a higher premium until the market value eventually normalizes.
Final Summary
$TRAC’s 27% rally continues as strong buying volume and rising holder count support the bullish momentum.
The Bollinger Band warns of potential selling pressure as $TRAC trades near the upper boundary.

 ambcrypto.com