NEAR price outlook: Can $4.69 support absorb the Intents selloff?
crypto.news
01 October 2026 18:11, UTC
$NEAR price fell below $5 on Oct. 1 following a reported $3.8 million exploit involving $NEAR Intents, with the token trading near $4.94 as its recent rally met a sharp pullback.
$NEAR Intents said the incident involved a bug in the interaction between its Omni deposit and withdrawal system and the platform’s smart contract. The team paused services, patched the contract-side vulnerability, and committed to reimbursing affected funds in full.
Earlier today $NEAR Intents services were stopped after a security incident was detected. The incident was caused by a bug in the Omni deposit and withdrawal infrastructure interaction with $NEAR Intents smart contract.
The preliminary report indicates the total loss of…
— $NEAR Intents (@near_intents) October 1, 2026
Know when your coins move
Alerts, real-time prices, and market news — all in one app
4.8 based on 40K reviews in the App Store and Google Play
Reports noted that the disruption affected cross-chain infrastructure associated with $NEAR Intents, rather than the underlying $NEAR Protocol blockchain. The platform also reported the incident to law enforcement and engaged security and blockchain analytics firms to trace the funds.
$NEAR price falls below $5 after testing $5.54
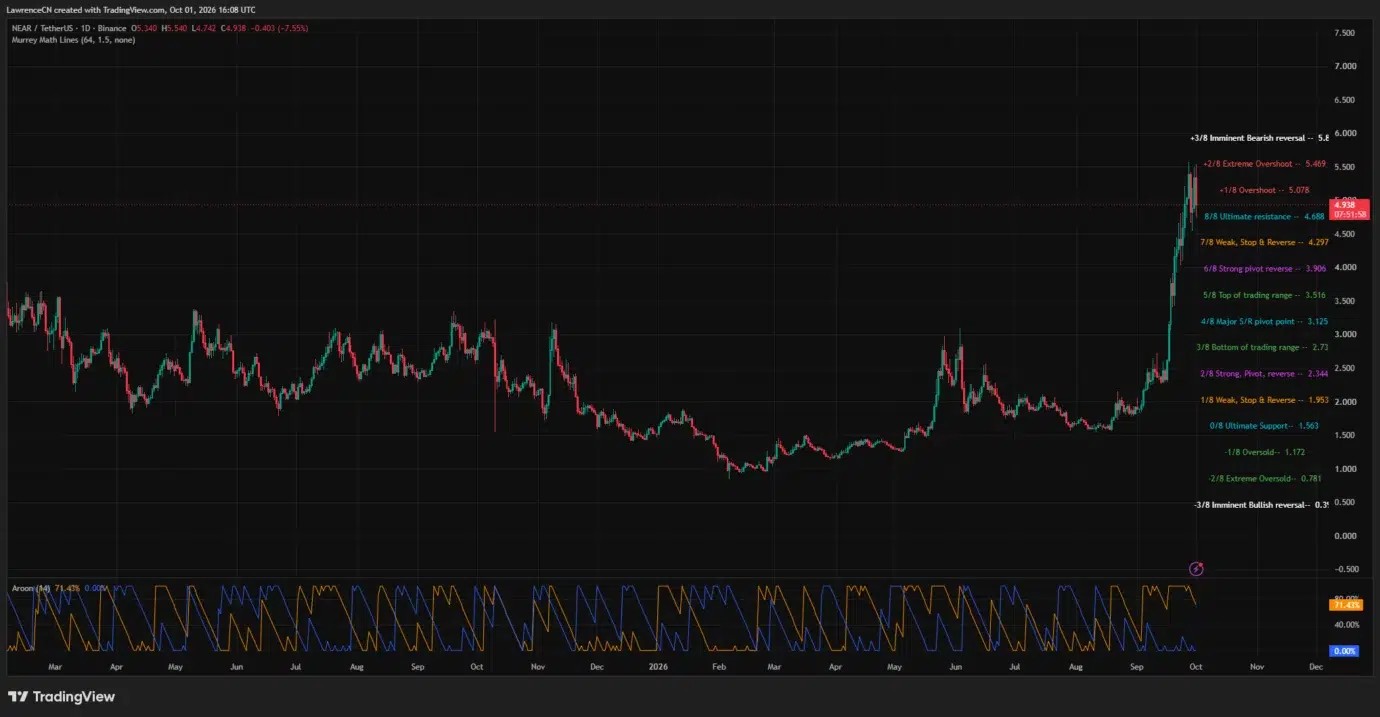
TradingView’s Binance daily chart places $NEAR at $4.938, down 7.55%, with a daily high of $5.540 and a low of $4.742. The price stood about 10.9% below that high at the chart snapshot.
The daily chart shows the retreat following a steep September advance from roughly the mid-$2 range. $NEAR crossed several price levels during that climb before reaching the $5.50 area, where the latest decline began.
The Murrey Math indicator places $NEAR below its $5.078 overshoot level after the price briefly moved beyond the $5.469 extreme-overshoot line. Both levels now sit above the market, creating nearby hurdles for a recovery.
The next marked daily level below the price is $4.688. $NEAR’s $4.742 daily low remained just above that line, making the $4.69–$4.74 area the nearest chart-based support zone.
A move below that area would bring the indicator’s $4.297 level into view, followed by $3.906. Those levels form a conditional downside map from the daily chart, with each lower target depending on a break of the preceding support.
The daily Aroon indicator still shows Aroon Up at 71.43% and Aroon Down at 0%. Recent highs therefore remain more prominent within its lookback period, even as the latest price decline interrupts the September advance.
$NEAR needs to reclaim $5.02 on the 4-hour chart
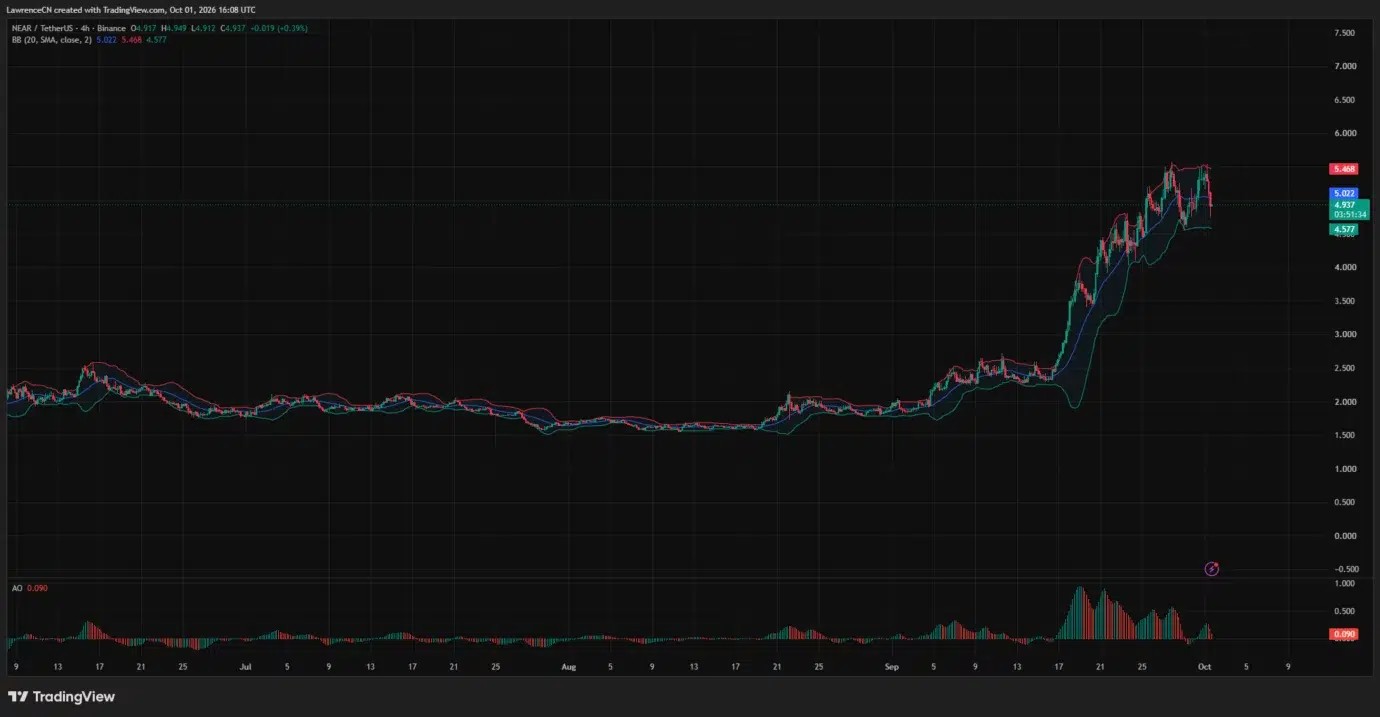
TradingView’s 4-hour chart shows $NEAR at $4.937, below the Bollinger Bands’ middle line at $5.022. The upper band stands at $5.468, while the lower band sits at $4.577.
The middle band provides the first nearby recovery level. A sustained move above $5.02 would also return $NEAR above the $5 threshold, although the daily chart’s $5.078 line would remain a further obstacle.
The upper Bollinger Band almost matches the daily Murrey Math level at $5.469. That overlap places two separate chart references around $5.47, close to the recent highs near $5.54.
On the downside, the lower band at $4.58 sits beneath the daily chart’s $4.69 support. A failure to hold the daily support zone would therefore leave another nearby reference around $4.58 before the lower daily levels.
The 4-hour Awesome Oscillator remains positive at 0.090, but its latest histogram bar is red. Momentum remains above the indicator’s zero line while weakening compared with the preceding bar.
$NEAR also remains well above its earlier September trading range around $2.30–$2.60 on the same chart. The immediate pullback and the larger monthly advance are visible across different timeframes.
Liquidation clusters sit above $5 and below $4.80
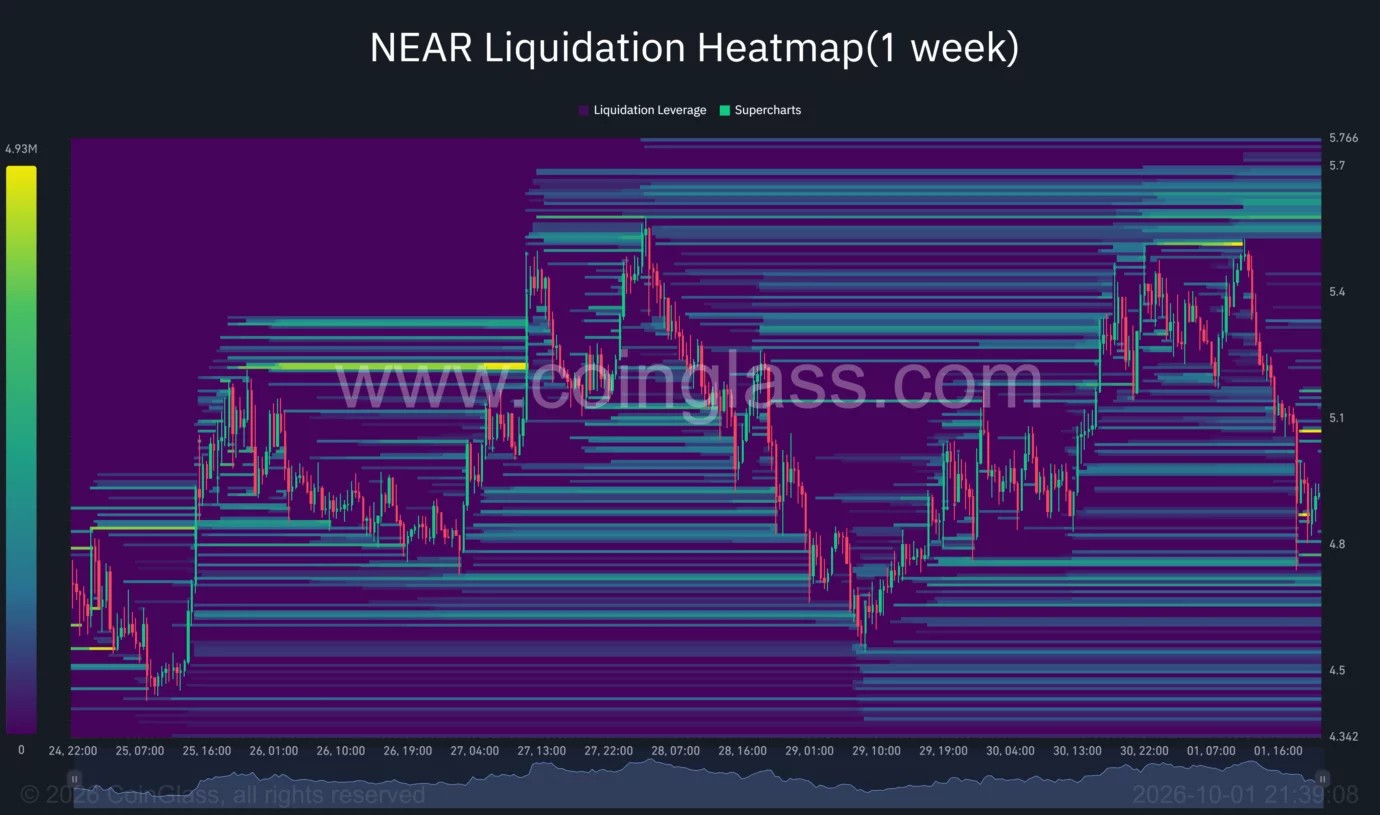
CoinGlass’s one-week liquidation heatmap shows $NEAR retreating from the $5.50 area toward $4.90, with a sharp downward move near the right edge of the chart.
$NEAR liquidation heatmap | Source: CoinGlass
A bright nearby liquidation cluster sits around $5.05–$5.10. Higher concentrations appear around $5.50 and across parts of the $5.60–$5.70 range.
Below the market, the heatmap shows several bands around $4.70–$4.80, followed by further concentrations near $4.60 and $4.45–$4.50. The $4.70 area overlaps the daily chart’s nearest support zone.
Taken together, the chart-based recovery path runs through $5.02–$5.10 before the $5.47–$5.54 region. The downside path begins around $4.69–$4.74, followed by the lower Bollinger Band near $4.58.
Analysts watch the breakout retest as NRR enters U.S. markets
Rekt Capital said in an Oct. 1 X post that $NEAR had rallied about 265% since a major trend reversal and recorded a monthly close above its macro downtrend for the first time in years.
The analyst expects $NEAR to attempt a retest of that former downtrend as support. His monthly chart marks horizontal levels at approximately $3.798 and $5.978, giving the longer-term assessment a wider range than the immediate daily setup.
In a separate Oct. 1 post, trader CW said accumulation signals persisted and argued that repeated replenishment of momentum supported the possibility of a sustained rally. Both analysts’ views remain conditional as $NEAR trades below $5.
The retreat also follows a new U.S. investment product. Bitwise announced that its $NEAR ETF began trading on NYSE Arca on Sep. 29 under the ticker NRR, with a 0.75% management fee and plans to stake its $NEAR holdings. The issuer also said $NEAR’s inflation rate had recently been halved to 2.5%.
For the immediate price setup, the daily and 4-hour charts place $4.69–$4.74 at the center of the downside test. A recovery would first need to clear $5.02–$5.10 before revisiting the resistance around $5.47.

 crypto.news