The average inflow per transaction rose 1.65% to 1.94 billion $SHIB, compared with 713.26 million for average outflows, which shows that deposits are coming in larger chunks than withdrawals. That pattern is typical of whale activity, since big holders tend to move size in single transfers.
Enough $SHIB to sell
Exchange reserves sit at 87.66 trillion $SHIB, up a marginal 0.05%, with their dollar value at roughly $505.77 million, down 0.81%. Active addresses edged up 0.96% to 753, and the seven-day chart shows a visible burst of address activity in recent days. The burned supply metric shows no reading.
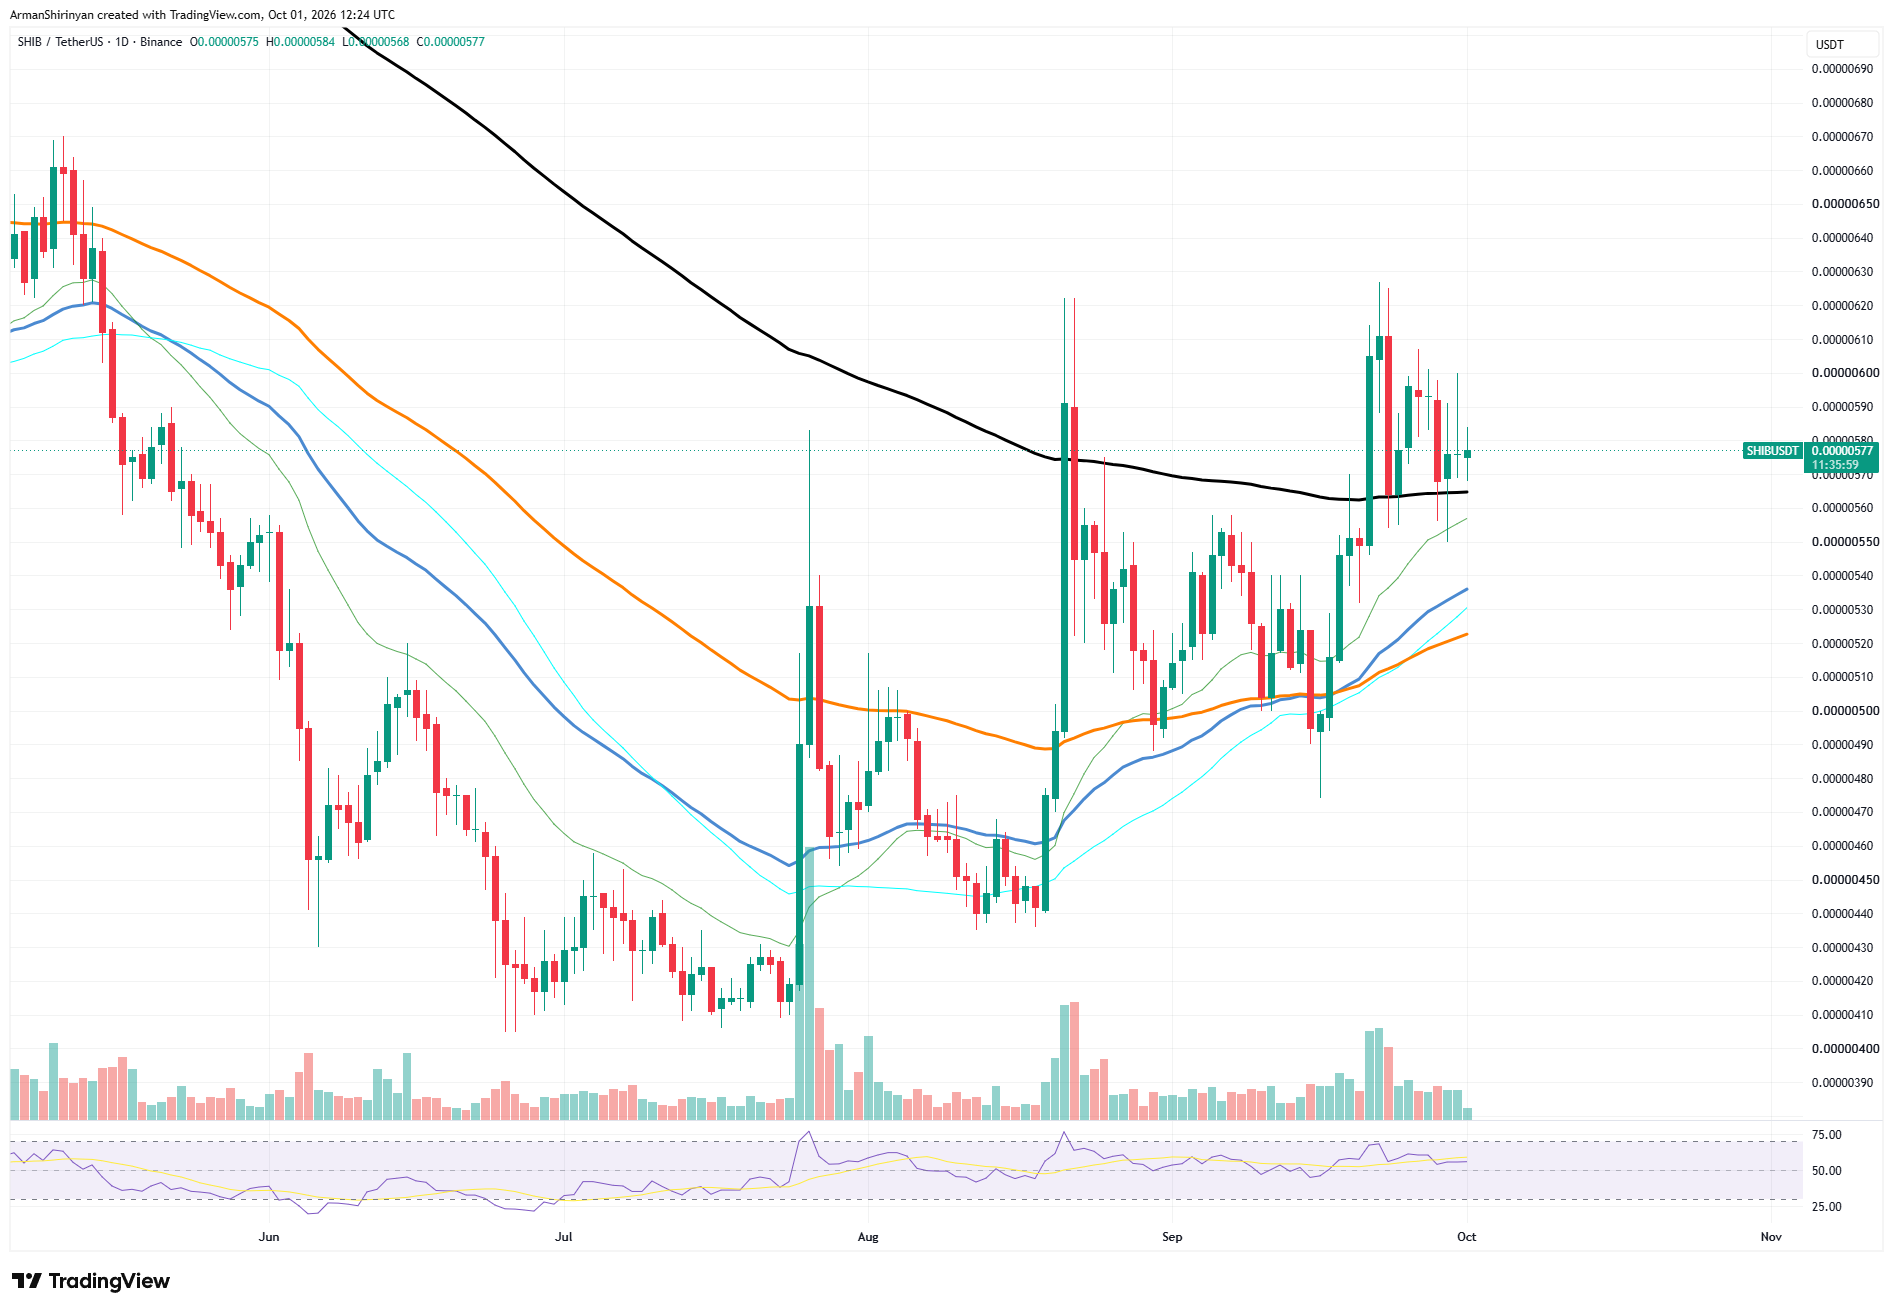
Price action reflects the same cautious mood. $SHIB trades at $0.00000578 and has pulled back from the $0.00000627 high reached in late September. It is holding just above the 200-day moving average near $0.00000565, a level that has acted as a pivot in recent weeks.
The shorter-term averages are climbing below it, between $0.00000523 and $0.00000557, forming a layered support zone. RSI sits near the midline, and recent volume has faded, so the market lacks a decisive push in either direction.
Whale inflows to exchanges can be read two ways. Traders often treat them as a warning of potential selling, since tokens must be on an exchange to be sold. Yet they can also signal repositioning ahead of accumulation or liquidity provision, especially when price is holding support.
The key level is the 200-day average. A hold keeps a retest of $0.00000600 to $0.00000627 in play, while a close below it would shift attention to $0.00000557 and then $0.00000537. Watching whether netflow turns negative will help clarify the intent.

 u.today