Price Prediction for XRP: Freedom By 40 Says, “In My Opinion, XRP Is Going to $9″
thecryptobasic.com
01 October 2026 14:48, UTC
Widely followed crypto trader and YouTuber “Freedom By 40” has shared his price prediction for $XRP, saying it could rise to between $5 and $9.
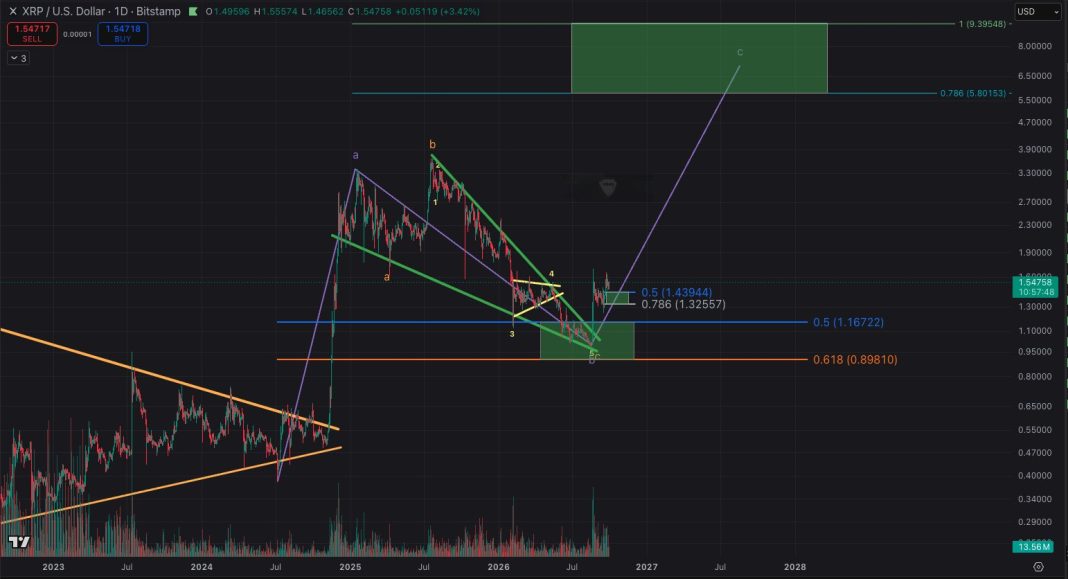
$XRP is currently trading around $1.49, well below his projected range. Meanwhile, his TradingView chart presents a long-term Elliott Wave analysis suggesting that $XRP could rise toward $9.
Price prediction for $XRP
Freedom By 40’s $XRP/USD chart on Bitstamp uses Elliott Waves, Fibonacci levels, and trendlines to argue how $XRP could rise into the 5–9 range.
Know when your coins move
Alerts, real-time prices, and market news — all in one app
4.8 based on 40K reviews in the App Store and Google Play
The analysis starts with $XRP’s long period of sideways movement from 2023 to late 2024. During this time, the price formed a pattern of lower highs and higher lows. $XRP broke out of this pattern in late 2024 at around $0.50 and then rallied above $3 in early 2025. That represented a gain of more than 6X.
Notably, the chart labels this rally as Wave A, followed by a correction called Wave B. It then suggests that a new Wave C is set to push $XRP well above its previous high.
$XRP: Daily USD Chart
Indeed, after $XRP’s 2025 peak, the price entered another correction. The chart shows this with downward-sloping green trendlines and smaller waves numbered 1 through 5. Wave 5 has reached around $0.90. This explains $XRP’s price fall from its $3.66 peak to $0.98 between mid-2025 and mid-2026.
Meanwhile, the $0.90 area also lines up with the 0.618 Fibonacci retracement level, which the analyst sees as the bottom of the correction.
Indeed, $XRP’s price has bounced significantly from that point, soaring to $1.70 before retracing to around $1.50 presently. The coin’s recovery may therefore mark the start of another upward move.
$XRP Eyeing a 504% Rise
The next Fibonacci levels to watch are around $1.167, $1.325, and $1.439, which are marked as areas of support should the coin lose momentum during the ongoing bounce.
Beyond these levels, the chart’s projected target zone stretches to $5.80 and $9.40. The lower target aligns with the 0.786 Fibonacci extension, while the upper boundary corresponds to the 1.0 extension shown on the chart.
If $XRP rises from its current price of $1.49 to $5.80, it would represent a gain of about 289%. Reaching $9.40 would amount to a gain of roughly 530%.
For a holder of 100,000 $XRP, a move to $9.40 would put the holdings at approximately $940,000, approaching the lofty $1 million mark.
Caution
While promising, it is worth noting that the $5.80 to $9.40 targets are technical projections. Elliott Wave analysis changes as new price data emerges, meaning the projected wave structure and targets could be invalidated if $XRP fails to follow the anticipated pattern.
The overall idea is that $XRP’s correction phase is over and that the bull market is just starting, although there will still be ups and downs along the way.

 thecryptobasic.com