XRP Between $1.45 and $1.65: Everything Else Is Noise
thecryptobasic.com
42 m
$XRP is at an important point, and analyst EGRAG says traders are focusing too much on small price movements instead of the bigger picture.
He says $XRP is currently trading between $1.45 and $1.65. Until the price clearly breaks above or below this range, these smaller movements are mostly noise.
“Everything Else Is Noise”
In a post on X, EGRAG said $XRP is stuck in a narrow range within a larger market trend. He identifies $1.45 as support and $1.65 as resistance. A clear move beyond either level will signal $XRP’s next major direction.
Know when your coins move
Alerts, real-time prices, and market news — all in one app
4.8 based on 40K reviews in the App Store and Google Play
$XRP is currently trading around $1.50, putting it near the lower end of this range. The coin briefly soared to $1.70 last month before quickly dipping below $1.30. Meanwhile, in September, it surged to $1.68 before falling back to around $1.50.
As this price action frustrates holders expecting explosive moves, EGRAG urged them to focus on $XRP’s broader price trend instead of reacting to every small movement.
As long as $XRP remains between $1.45 and $1.65, he sees no major reason to change his overall view.
Above $1.65: A breakout would signal a stronger recovery and weaken the bearish outlook.
Below $1.45: A breakdown would increase the risk of a deeper price drop.
For long-term holders, EGRAG sees the current price area as an opportunity to accumulate $XRP. However, he says this does not mean a new bullish trend has started.
$XRP Chart Shows Possible Downside Targets
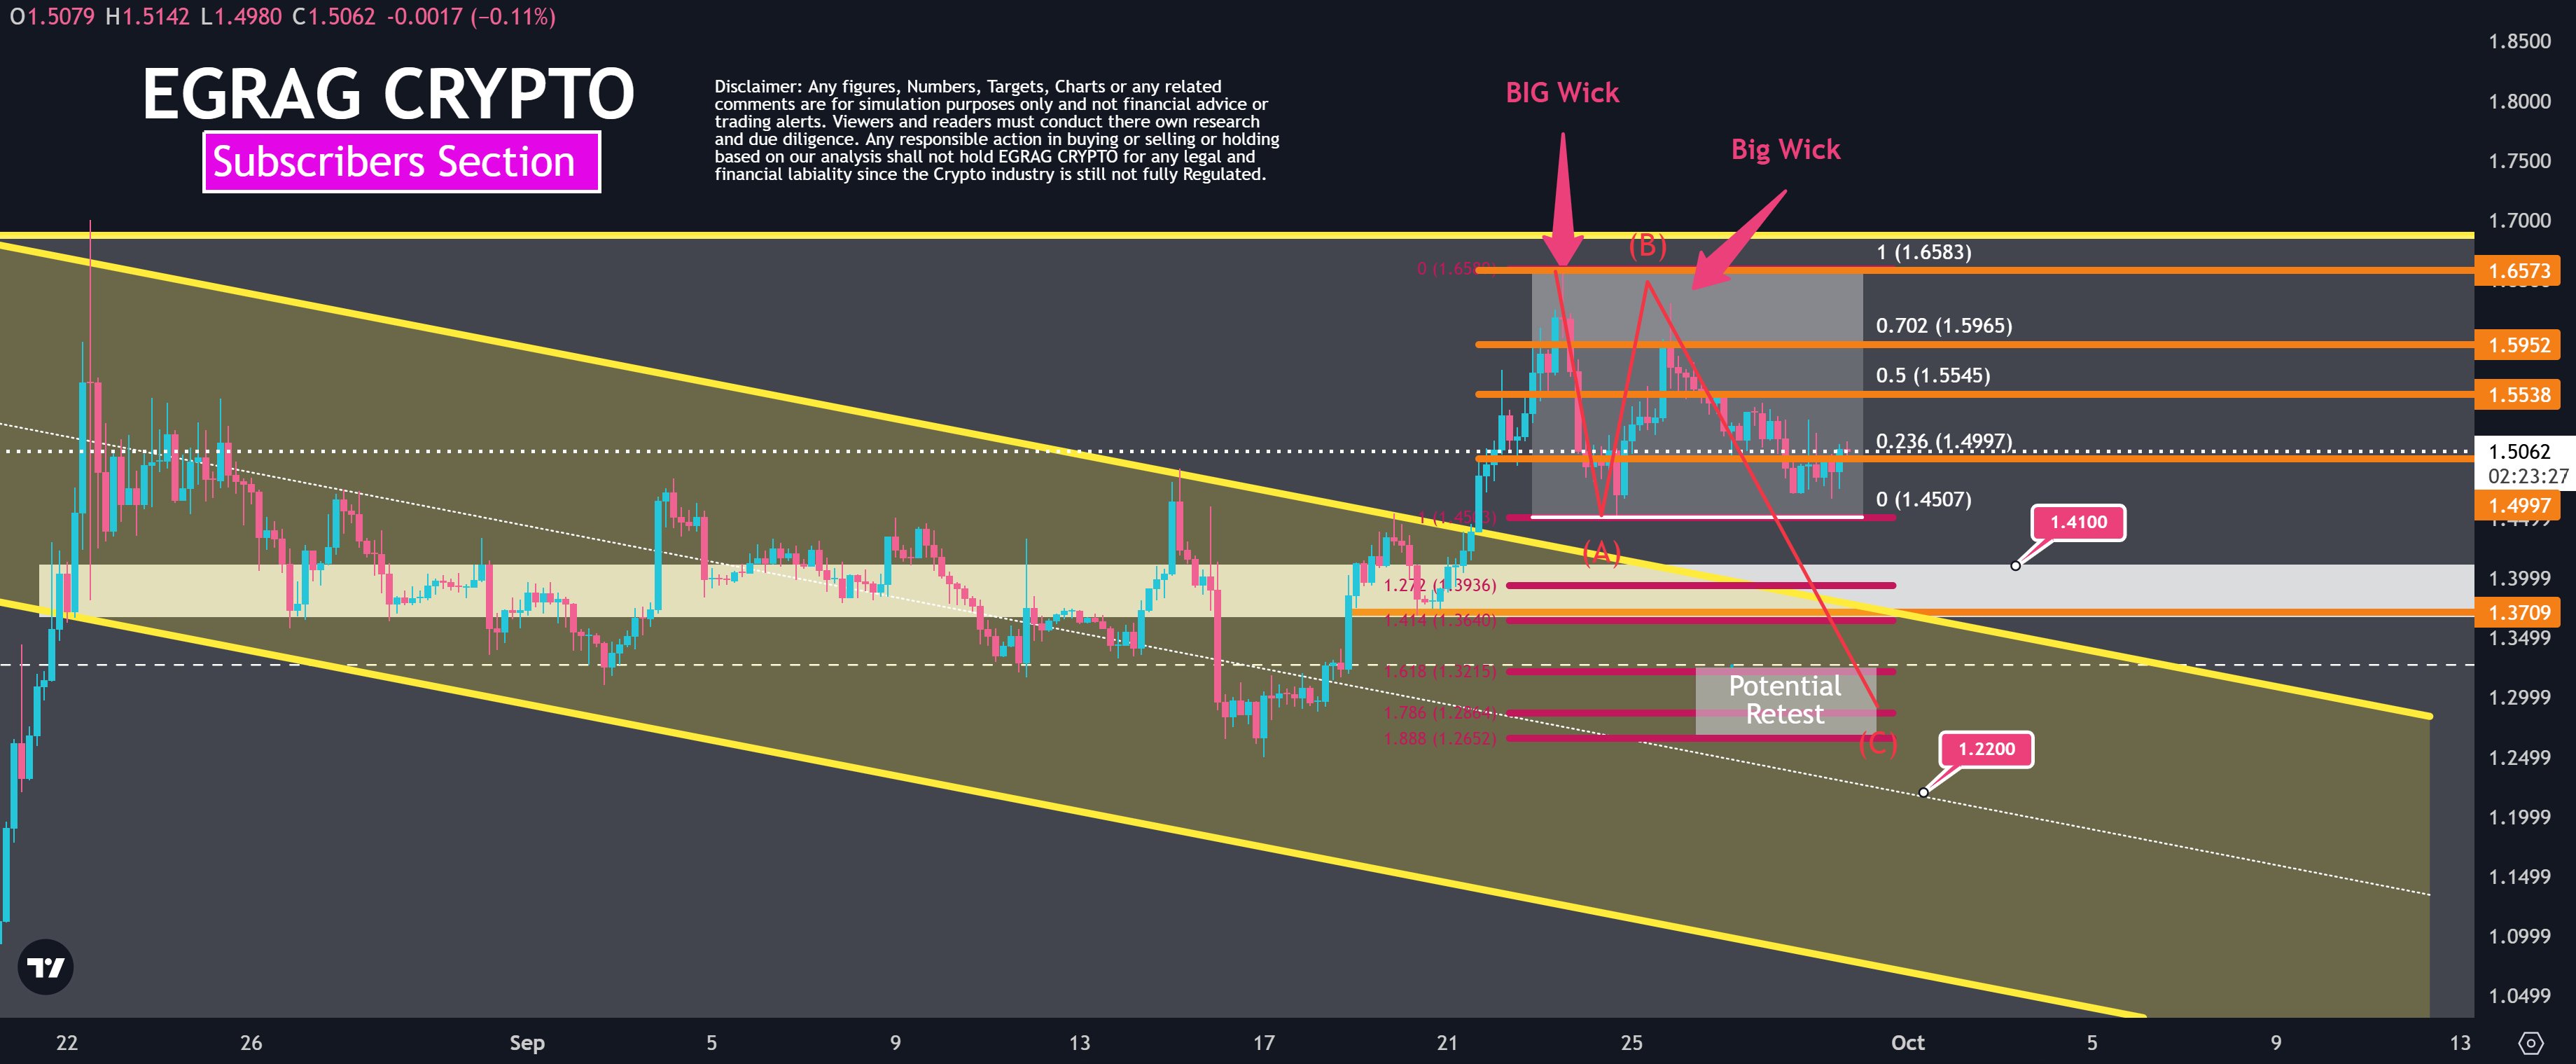
Meanwhile, the accompanying chart shows $XRP trading inside a larger downward channel. $XRP is around $1.5062 and is testing several important price levels.
Key levels to watch include $1.4997, which currently acts as support. $XRP would need to break above $1.5545 and $1.5952 to strengthen its recovery. The key level is $1.6583, which closely matches EGRAG’s $1.65 upper range boundary.
The chart also shows two sharp price spikes near $1.65. These show that $XRP has moved higher into this area before but failed to sustain a breakout.
EGRAG’s chart follows an ABC correction pattern:
A: The first drop.
B: The recovery.
C: The second drop.
If the C-wave develops, EGRAG points to downside levels around $1.40, $1.37, $1.32, $1.28, and $1.22.
EGRAG $XRP Chart
EGRAG Plans to Buy More $XRP Below $1.30
Even though EGRAG sees further downside for $XRP, he has not changed his long-term strategy. He said he would consider buying more $XRP if the price falls to $1.30 or lower. This means he views a deeper decline as a buying opportunity, as he believes $XRP’s long-term prospects remain promising.
EGRAG is a well-known $XRP bull who has previously projected several double-digit price targets for $XRP, making the $1 range an opportunity, in his view, to accumulate more of the coin.
In sum, EGRAG believes traders should avoid overreacting to small price movements and instead focus on the larger market structure.

 thecryptobasic.com