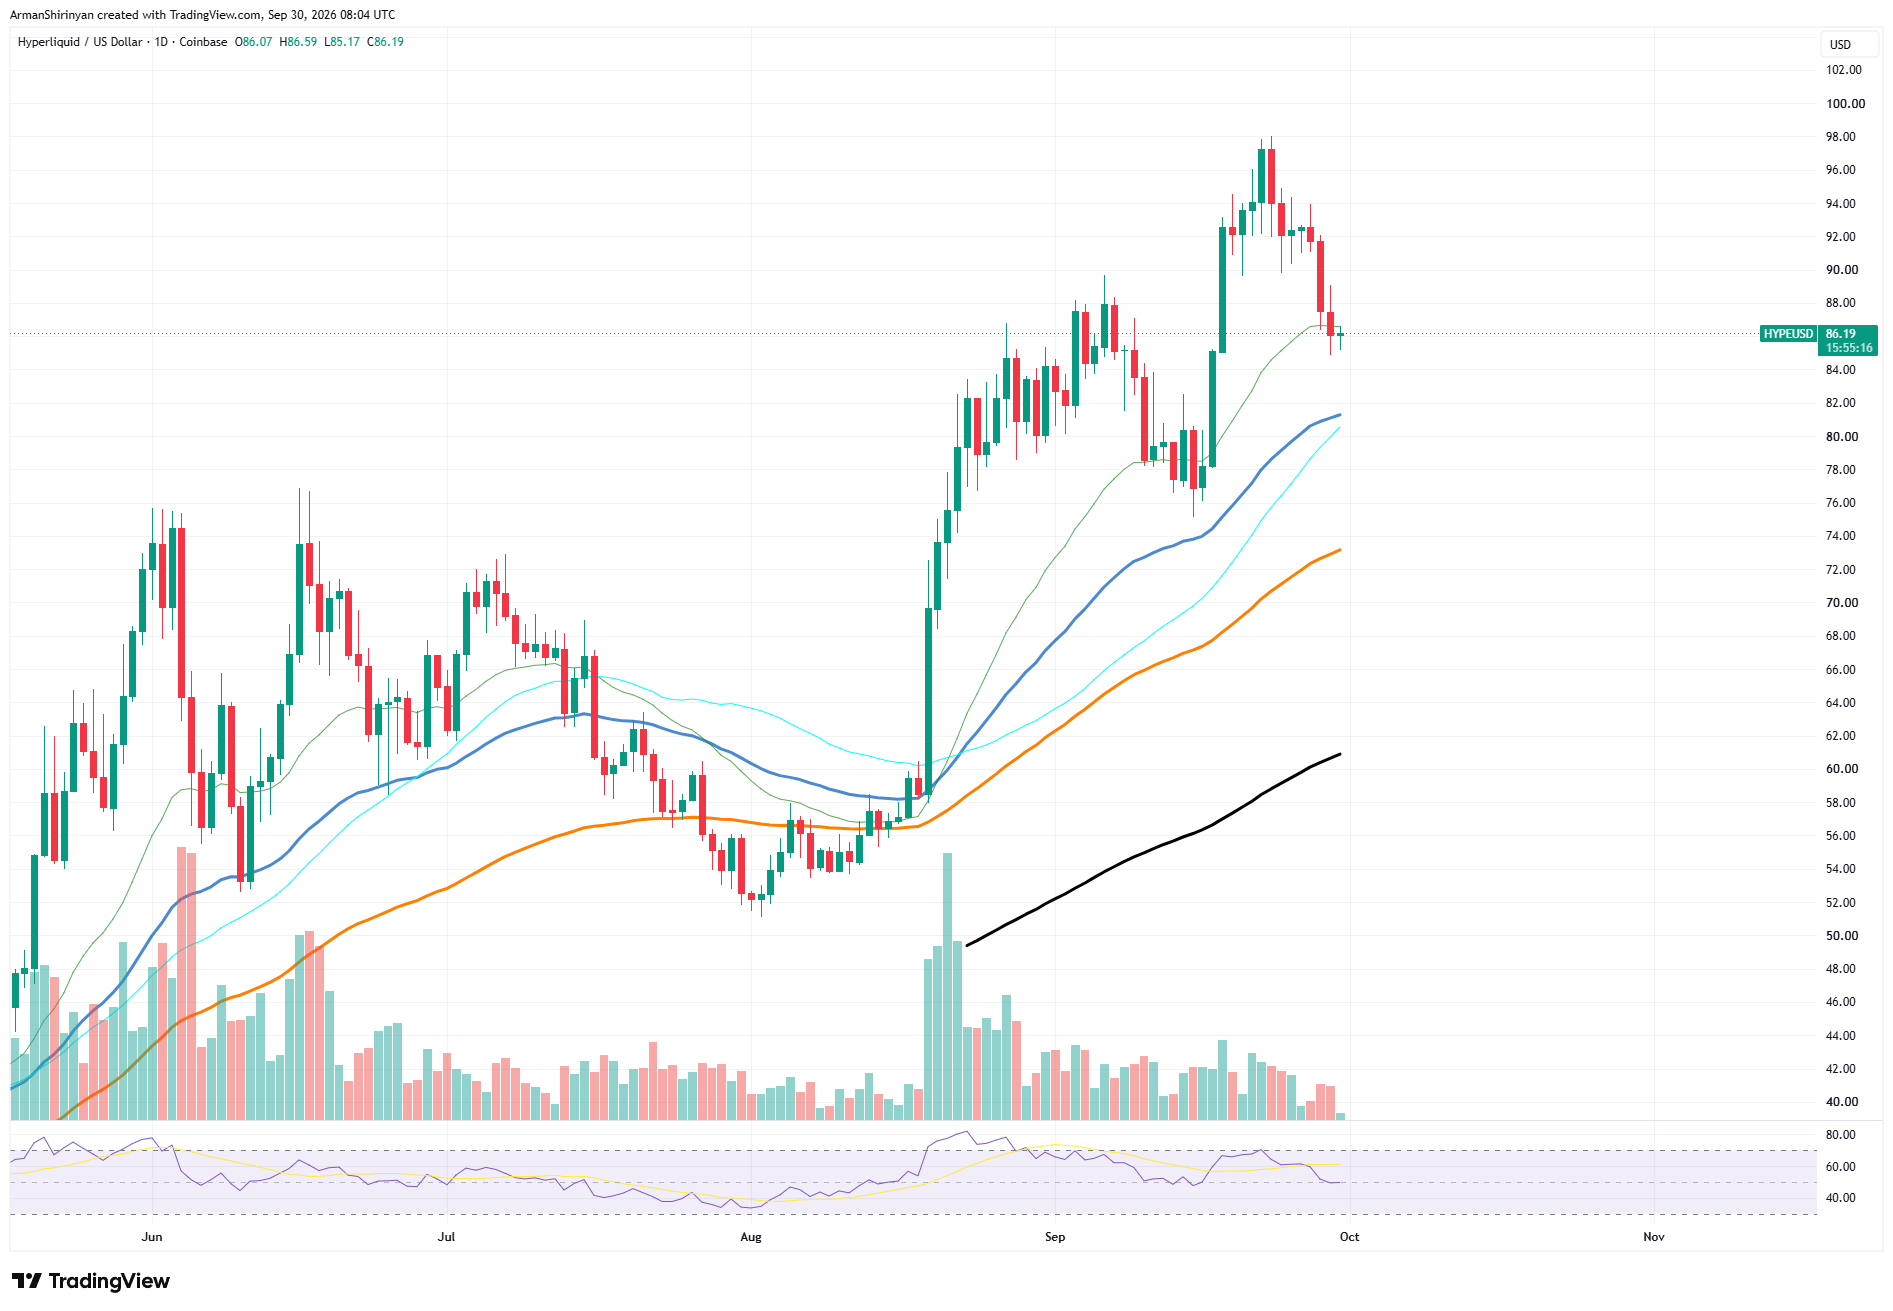
The damage is visible in the structure. After the local top near $98, $HYPE printed a series of lower highs and a long red candle that erased several days of gains in a single session. A break of a level that held through an entire uptrend is typically the first sign that momentum is shifting from buyers to sellers.
The RSI has dropped from the upper range to about 50, which confirms that bullish momentum has faded, although the reading is neutral rather than oversold.
The August breakout was backed by heavy participation, but volume has been shrinking through September, and the recent selloff came with only moderate activity. That means the decline is not yet a panic, but the rally is also no longer attracting fresh demand.
Where the Next Support Sits
The bigger picture remains constructive. All longer-term averages are rising and stacked in bullish order. The next meaningful support zone is around $81 to $82, where the blue and cyan averages converge. Below that, the orange average near $73 and the long-term black line around $61 mark deeper cushions if selling accelerates.
On the upside, bulls need to recapture the $88 to $90 area to invalidate the breakdown. Failing that, the $75 to $78 range, the September low, becomes the next logical test.
The trend is not broken, but the rules have changed. $HYPE lost the level that defined its bull run, and until it climbs back above it, the path of least resistance points toward a deeper pullback toward the rising averages below.

 u.today