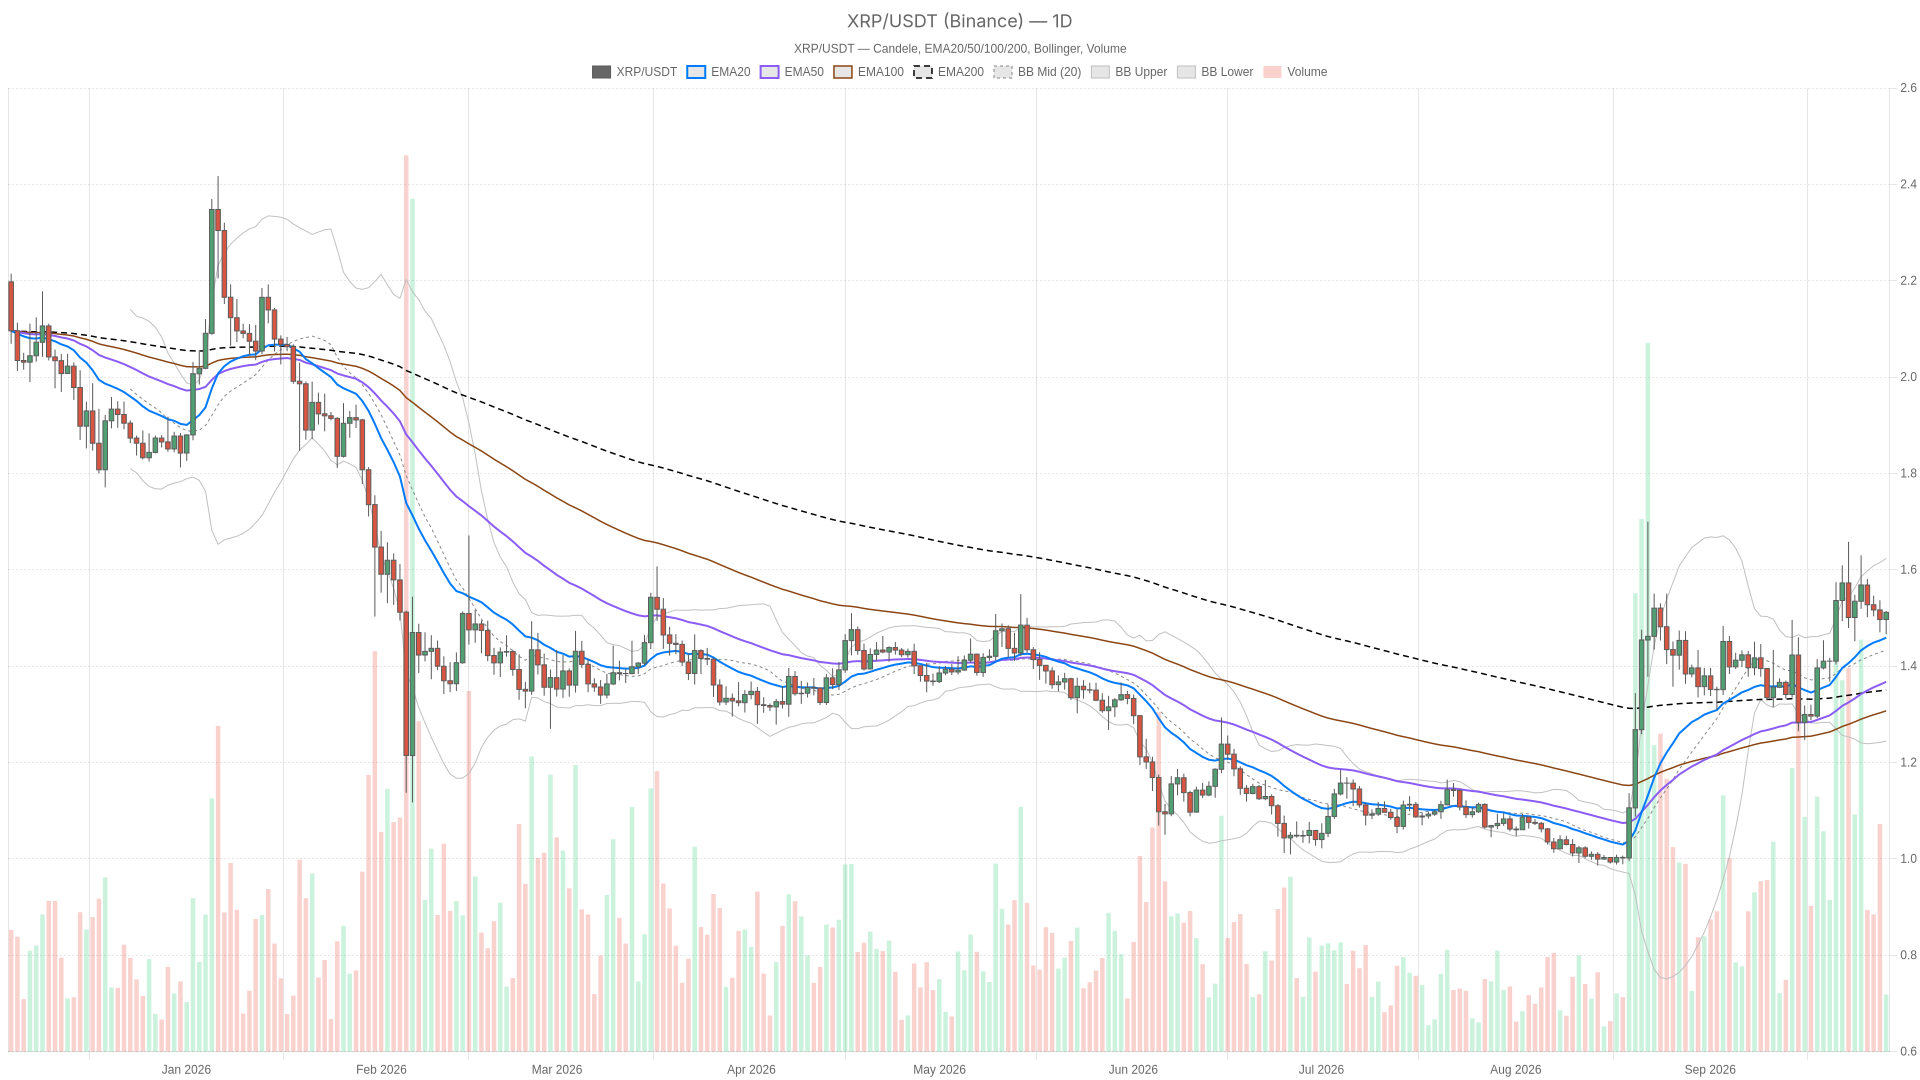
The Daily Chart Still Belongs to the Bulls
On the daily timeframe, $XRP is trading at $1.51, comfortably above its 20-day EMA at $1.46, its 50-day EMA at $1.37, and its 200-day EMA at $1.35. That stacked EMA order — price above the short-term average, which sits above the medium-term, which sits above the long-term — is a textbook bullish structure. Every buyer who entered over the last few weeks is currently sitting on unrealized gains, which tends to reduce the urge to panic-sell into weakness.
The daily RSI reads 57.82, firmly on the bullish side of neutral without being anywhere near overbought territory. That is actually a healthier signal than a reading pinned above 70 — it suggests there is still room for the trend to extend before momentum traders start taking profits en masse. MACD on the daily is essentially flat, with the line and signal both at 0.05 and a histogram reading of zero. However, that is not a bearish signal but a pause signal: the trend has not reversed, it has simply lost some acceleration for now.
Bollinger Bands on the daily frame have the midline at $1.43, the upper band at $1.62, and the lower band at $1.24. Price sitting above the midline but still well inside the bands confirms the bullish bias without flagging any extreme, overstretched move. The daily ATR of $0.09 gives a sense of how much room $XRP typically covers in a single session right now — enough to matter, but not violent. Moreover, pivot levels for the day sit at $1.50 (pivot), $1.53 (resistance) and $1.48 (support), which roughly frames the battleground traders are watching in real time.
Lower Timeframes: A Market Holding Its Breath
This is where the picture gets more nuanced. On the 1-hour chart, price is at $1.51, and the 20, 50, and 200-period EMAs have all converged at exactly $1.50. When moving averages of different lengths collapse into the same price, it usually means the market has entered a compression phase — volatility has been squeezed out, and traders are waiting for a catalyst before committing directionally. The 1H RSI at 56.03 backs that up: it is mildly bullish-leaning but nowhere near strong enough to argue for an imminent breakout on its own.
MACD on the 1-hour is dead flat at 0.00 across the line, signal, and histogram — about as clear a “wait and see” reading as you will find. Bollinger Bands have tightened dramatically too, with the upper band at $1.52 and the lower band at $1.47, a band width of just five cents. That is a classic pre-move squeeze pattern, though it says nothing about which direction the eventual move will take. The hourly ATR of $0.02 confirms just how muted intraday volatility has become.
The 15-minute chart tells a similar story in terms of structure — EMAs bunched at $1.50, tight Bollinger Bands between $1.49 and $1.52 — but the RSI here is more interesting at 63.91, noticeably warmer than both the 1H and daily readings. That divergence, where the fastest timeframe shows more bullish momentum than the slower ones, often reflects short-term buying pressure trying to nudge price higher into resistance. For anyone checking prices for execution purposes, the 15-minute chart is useful for timing entries, but it should not be mistaken for a trend signal on its own.
Reading the Tension Between Timeframes
The honest tension in this setup is clear: the daily chart says bullish, the hourly chart says neutral-and-compressed, and the 15-minute chart shows a mild pickup in momentum that has not yet been confirmed by anything larger. None of these signals contradict each other outright, but they do not align cleanly either. This is a market where the macro bias is intact but the immediate next move is genuinely unclear — exactly the kind of environment where forcing a trade based on one timeframe alone tends to backfire.
Context matters here too. According to CoinGecko data, total crypto market capitalization sits around $2.87 trillion, down about 1.1% over 24 hours, while Bitcoin dominance holds near 58.8%. That combination — a slightly red overall market with Bitcoin still commanding the lion’s share of capital — often means altcoins like $XRP need either a market-wide risk-on shift or an asset-specific catalyst to break out of compression. Moreover, the Fear & Greed Index reading of 73, classified as “Greed,” adds another layer: sentiment is leaning optimistic even as price action itself has gone quiet, which can either precede a fresh leg higher or set up a sharper pullback if that optimism is not backed by follow-through volume.
Bullish Scenario
If $XRP can clear the daily pivot resistance at $1.53 with real volume, and the 1-hour EMAs start fanning back out with price leading above $1.50 decisively, that would confirm the compression is resolving upward. In that case, the daily Bollinger midline at $1.43 and the 20-EMA at $1.46 become the levels bulls would want to hold on any retest, keeping the broader uptrend structure intact. A push toward the upper daily band near $1.62 would be the next logical target if momentum actually returns to the MACD.
Bearish Scenario
The bearish case is not about a trend reversal yet — it is about failure to hold the current base. If price loses the daily pivot support at $1.48 and starts trading persistently under the $1.50 cluster where all three 1H EMAs sit, that would flip the short-term structure bearish even while the daily EMAs remain stacked bullishly. A deeper break below the 20-day EMA at $1.46 would be the first real warning that the daily uptrend itself is losing conviction, with the 50-day EMA at $1.37 as the next meaningful floor to watch. That said, what would invalidate the bullish read specifically is a daily close back under $1.46 with rising volume — that is the line between a healthy pause and trend fatigue.
Where This Leaves Traders
Ripple price today is essentially a market caught between a bullish macro backdrop and a compressed, indecisive short-term structure. That is not a comfortable setup for anyone looking for a clean directional bet — it rewards patience and punishes chasing either breakout candles or minor dips without confirmation. The tight ranges on the 1-hour and 15-minute charts mean volatility is likely to expand soon in one direction or another. However, the daily trend gives a slight edge to the upside case, while sentiment already sitting in “Greed” territory means there is less room for surprise good news to move the needle without a corresponding risk of profit-taking. Position sizing and clear invalidation levels matter more than usual here, given how narrow the current trading band has become relative to the asset’s typical ATR.
FAQ
What is $XRP’s current price level?
As of September 29, 2026, $XRP is trading at $1.51, holding above all three major daily EMAs (20-day at $1.46, 50-day at $1.37, and 200-day at $1.35).
Is the daily trend for $XRP bullish or bearish?
The daily trend remains bullish with $XRP trading comfortably above its 20-day, 50-day, and 200-day EMAs in a textbook stacked order. The daily RSI at 57.82 confirms bullish momentum without entering overbought territory, suggesting there is still room for the trend to extend.
Why are the lower timeframes showing no movement?
The 1-hour and 15-minute charts show EMA convergence at $1.50 and extremely tight Bollinger Bands, indicating a classic volatility compression phase. This means the market is waiting for a catalyst before committing to a directional move, and it does not signal a trend reversal on its own.
What are the key levels to watch for a breakout?
For a bullish breakout, $XRP needs to clear $1.53 with real volume. On the bearish side, a loss of the $1.48 support and a daily close below $1.46 would be the first warning that the uptrend is losing conviction.
Disclaimer: This article is for informational purposes only and does not constitute financial advice, an investment recommendation, or a solicitation to buy or sell any financial instrument or cryptocurrency. The analysis provided is not indicative of future results. Investing in crypto assets and financial markets carries a high risk of capital loss. Always do your own research (DYOR) and consult a qualified financial advisor before making any decision.
Article produced with the assistance of artificial intelligence and reviewed by the editorial team.

 en.cryptonomist.ch