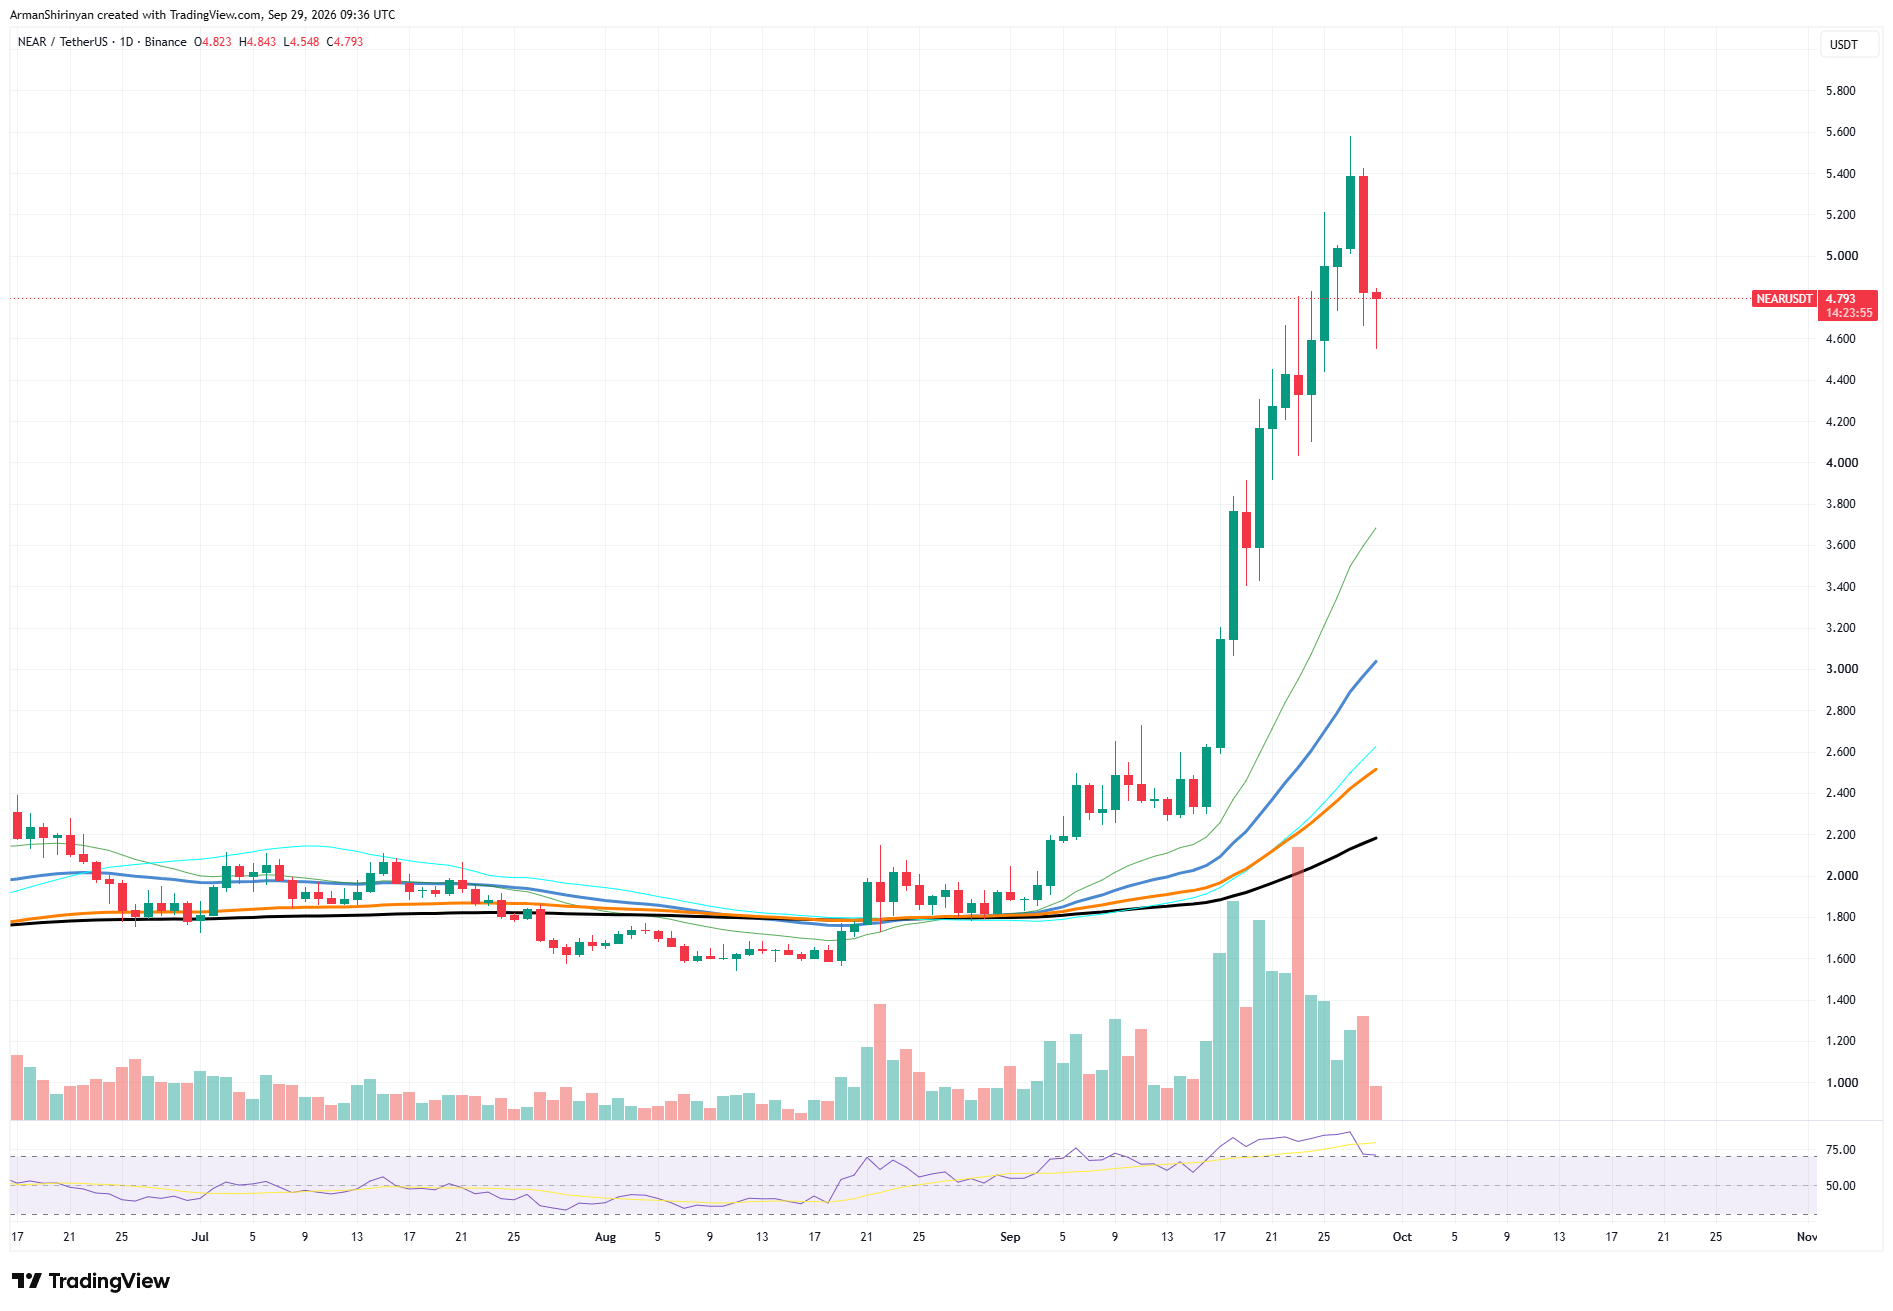
The price has since fallen below the $5.00 psychological level after sellers intervened forcefully at the top, as evidenced by the wick reaching $5.58. The September 23 red candle also saw a spike in selling volume, indicating that distribution started well before the most recent decline.
Market isn't stable
Additionally, momentum indicators are flashing caution. Before sharply declining, the relative strength index moved deep into overbought territory and momentarily approached the 85 area. Stretched readings seldom resolve sideways, and the cooling off frequently manifests as a wider retracement. The difference between the price and its moving averages conveys the same information.
The blue mid-term line at $3.00, the long-term averages between $2.20 and $2.60, and the short-term average near $3.70 are all significantly above $NEAR. A drop to the $3.80 to $3.70 range would indicate a 20% drop from the current level.
Prices that are this far from their averages typically move back toward them. It makes sense to target that zone. It coincides with both the rising short-term moving average, which may serve as dynamic support, and the breakout area around $3.80, where the rally picked up speed. The $3.00 area would be the next significant test below it.
In order to invalidate the reversal signal and reopen the path to the $5.58 high, bulls need to recover above $5.00 with significant volume. The risk balance is tilted further downward until that occurs.

 u.today