Hedera explodes 29.8%, clears February highs at $0.107 – Inside HBAR’s rally
ambcrypto.com
3 h
Hedera [$HBAR] has rallied 29.8% in the past 24 hours, with an Open Interest spike of over 80% in a day. Its daily trading volume was $619.5 million, a 718% increase day-on-day, according to CoinMarketCap data.
What spurred the sudden gains?
On the 23rd of September, The Hashgraph Group announced that its IDTrust self-sovereign identity platform had been validated and officially listed on the IBM Cloud Catalog.
News came out that Hedera joined the UK’s Wholesale Digital Markets Champion Taskforce, strengthening the institutional adoption narrative.
More Than Just News Content, live market tracking, portfolio management, and price alerts — everything you need in the Crypto News app. Download now, stay on top of the crypto market, and take control of your information.
Source: $HBAR/$USDT on TradingView
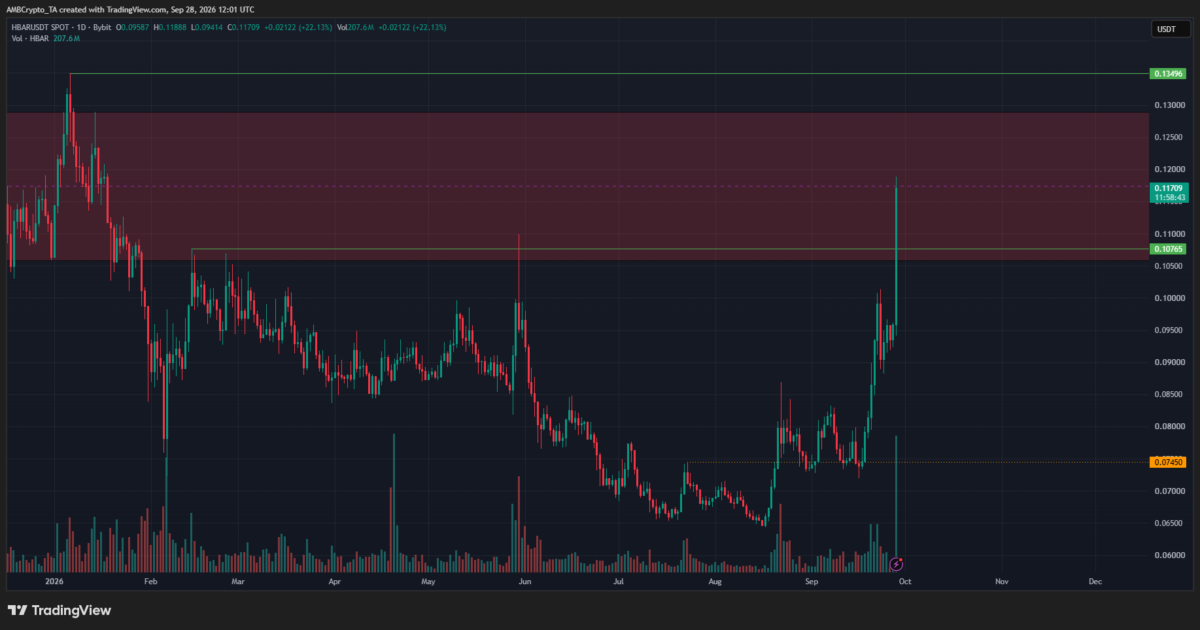
It can be argued that these news events came alongside a Hedera uptrend. The downtrend on the daily timeframe stretched back to September 2025. A lower high at $0.0745 made in July was breached in August.
In recent weeks, the same level was retested as support before the price moved even higher. It has now surpassed the $0.107 swing level from February, a strong sign that a bullish recovery is underway.
Source: $HBAR/$USDT on TradingView
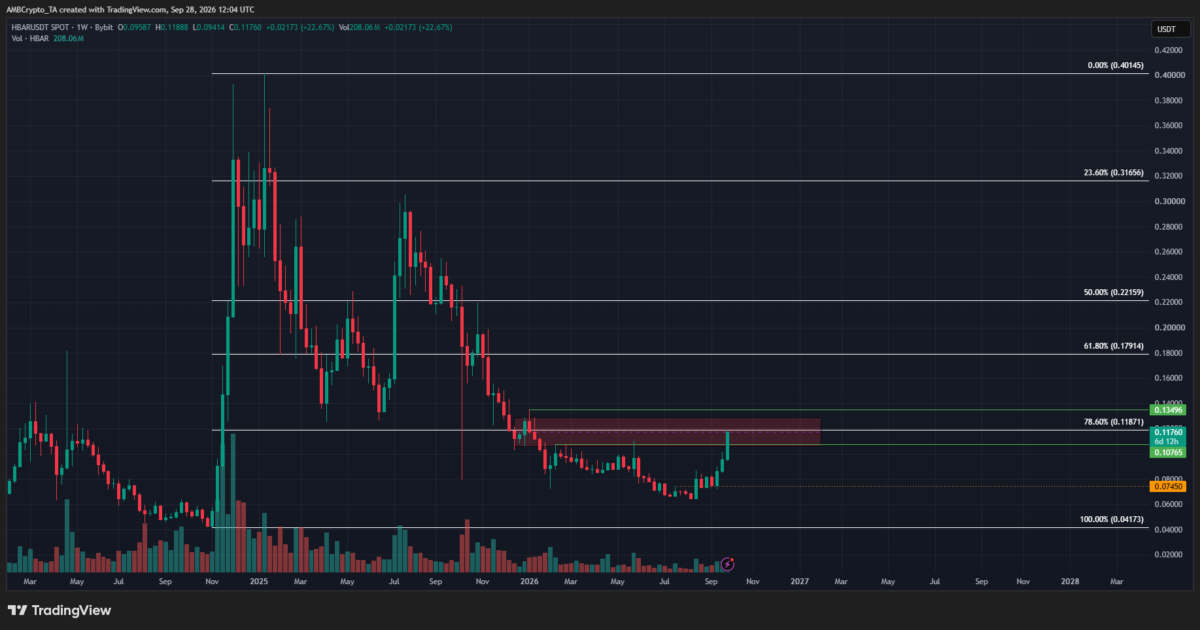
The weekly chart showed $HBAR’s bullish swing structure from late 2024, and the extended downtrend since 2025 was part of the retracement. The 78.6% Fibonacci retracement level at $0.118 was being challenged.
Moreover, the $0.105-$0.128 area (red) represented a supply zone from November 2025. If these resistances are breached, the odds of an $HBAR recovery would dramatically increase.
Traders’ call to action – Take profits
Source: $HBAR/$USDT on TradingView
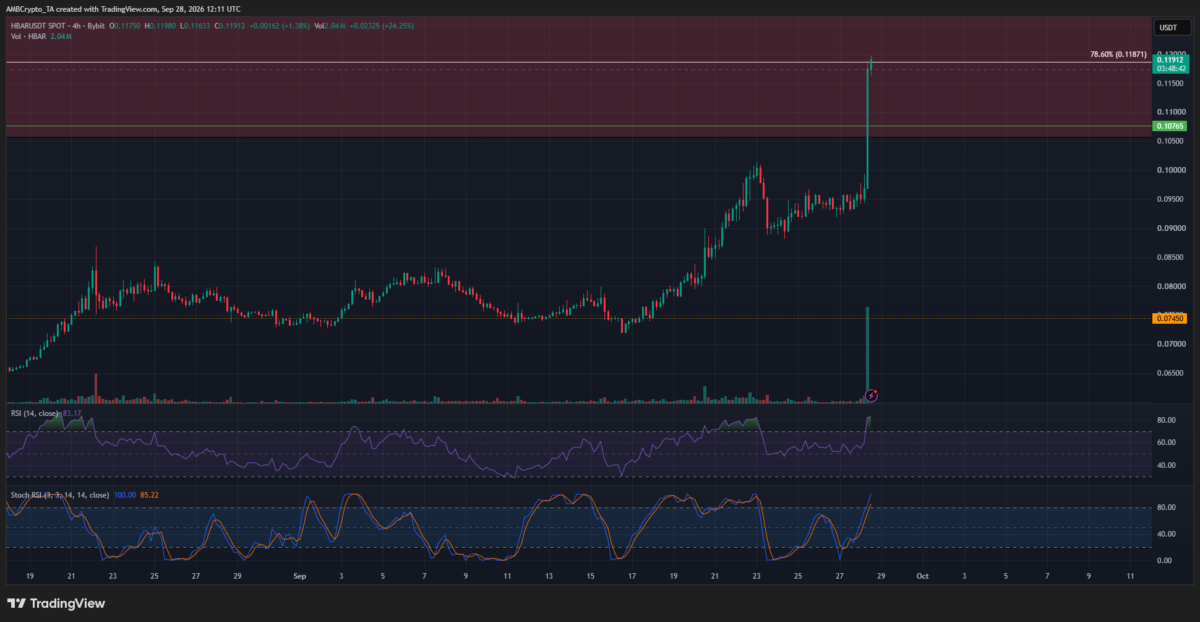
The recent 4-hour session’s trading volume was extraordinary, matched in magnitude only by the October 2025 crash. Such high-volume price spikes into a long-term supply zone can be a good area to take profits at.
Swing traders and investors can wait for a pullback to $0.10 to buy. Alternatively, they can also seek to re-enter the long side after a breakout past the $0.128 weekly resistance level.
Final Summary
Hedera has smashed aside local resistance levels and challenged February highs with its high-volume price surge.
The extremely high volume and overbought momentum indicators on the 4-hour chart cautioned that profit-taking and buying the pullback could be a viable strategy.

 ambcrypto.com