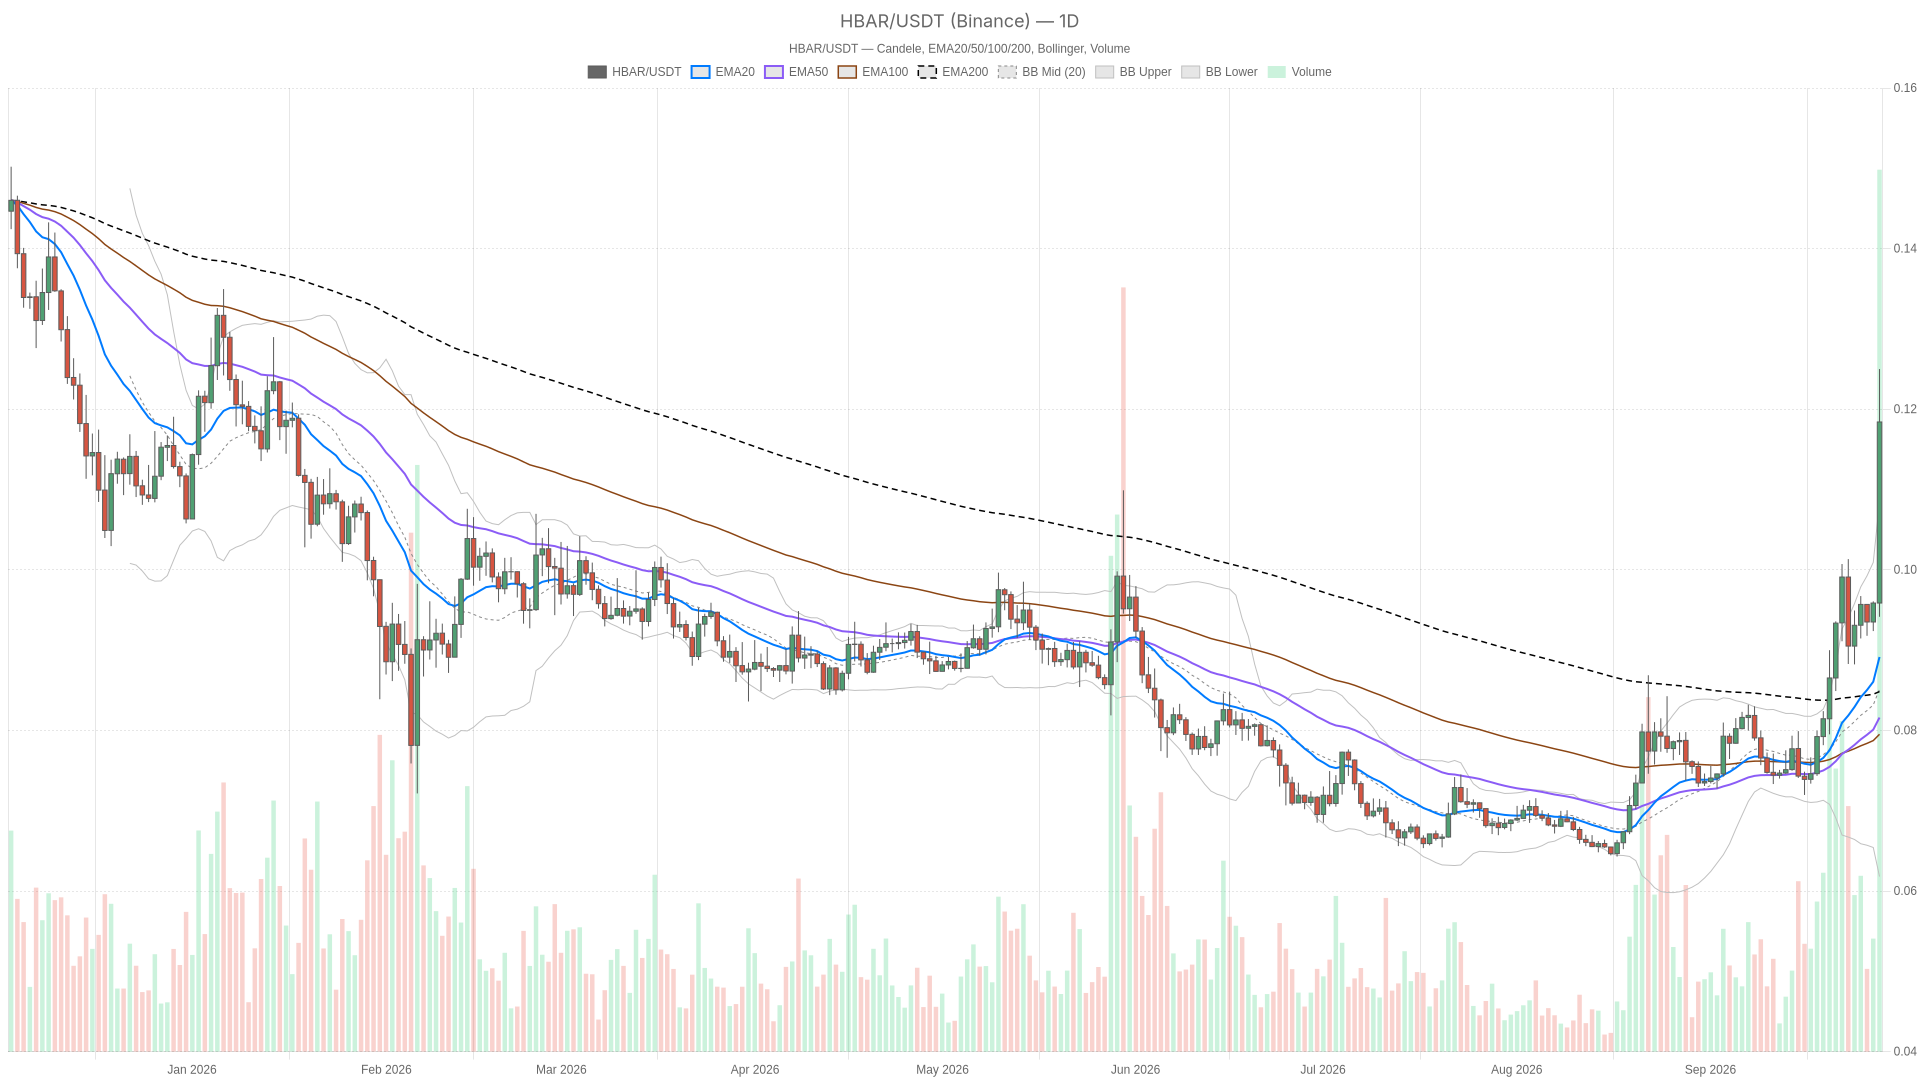
The dominant force on the daily chart is a strong, extended uptrend that has pushed price well above every major moving average, yet the momentum readings are screaming exhaustion. When a trend gets this stretched while the broader tape is losing value, the question is not whether the move was real — it clearly was — but whether it has any fuel left before buyers need to catch their breath.
Daily chart: $HBAR extends far above its moving averages
$HBAR’s daily chart shows a strong, extended uptrend with price at $0.12 far above every major moving average, yet momentum indicators are flashing clear exhaustion signals. On the daily timeframe, $HBAR is trading at $0.12 against an EMA20 of $0.09, EMA50 of $0.08, and EMA200 of $0.08. That is a significant gap between spot price and every trend-following average, which tells you this is not a slow grind — it is a sharp, momentum-driven expansion. When price runs this far ahead of its own EMA stack, the trend is intact but statistically due for either a pause or a retest of one of those averages before the next leg.
Meanwhile, the daily RSI at 79.02 confirms the overbought read. That is not a level that guarantees a reversal, but it does mean the easy, low-risk entries are behind us for now. MACD is still constructive — the line sits at 0.01 above a signal of 0 — yet the histogram has flattened out to roughly zero, which is a subtle warning that the bullish thrust is losing acceleration even though direction has not flipped yet.
Additionally, Bollinger Bands add another layer to this picture: the daily upper band sits at $0.11, and price at $0.12 is trading outside it, with the mid-band at $0.09 and the lower band down at $0.06. Price living outside the upper band is a classic sign of an extended move — it can persist in a genuine breakout, but it also raises the odds of a snap back toward the mid-band if buying pressure eases. ATR14 at 0.01 is modest in absolute terms, but relative to a $0.12 price it represents a meaningful daily range. The daily pivot structure — pivot point at $0.11, resistance (R1) at $0.13, and support (S1) at $0.10 — frames the immediate battle: $HBAR is sitting just above pivot, with $0.13 as the next logical magnet if strength continues and $0.10 as the first line of defense if it does not.
1H structure: bullish regime with momentum stretched thin
$HBAR’s hourly chart confirms a bullish regime with price above a clean stack of rising averages, though the RSI reading of 86.72 signals extreme overbought conditions that rarely sustain for long. The 1-hour chart is tagged as a bullish regime, and the numbers back that up on the surface — price at $0.12 versus an EMA20 and EMA50 both at $0.10, and an EMA200 at $0.09. That is a clean stack of rising averages underneath price, which is exactly what you want to see confirming a daily uptrend. The problem is the RSI reading of 86.72, which is about as stretched as this indicator gets on an hourly basis. MACD is still marginally positive (line at 0.01 versus a signal of 0), so the intraday trend has not technically broken, but an RSI this high rarely sustains itself for long without at least a shallow pullback.
Moreover, the Bollinger setup mirrors the daily picture: mid-band at $0.10, upper band at $0.12, and price sitting right at that upper boundary. In other words, $HBAR is riding the top of its own volatility envelope on both the daily and hourly charts simultaneously — a stacked overbought condition that confirms the trend direction but also concentrates the risk of a reversion move if momentum stalls.
15-minute view: momentum is already cooling
The 15-minute chart reveals that short-term momentum is already fading, with RSI cooling to 65.9 and MACD showing a minor bearish crossover, even as the hourly regime remains labeled bullish. This is where the multi-timeframe picture starts showing some real friction. The 15-minute RSI has dropped back to 65.9, a noticeable cool-down from the 86.72 reading on the hourly chart. MACD on this timeframe has actually flipped slightly negative, with the line at 0 sitting just under a signal of 0.01 — a minor bearish crossover that suggests short-term momentum is fading. Price at $0.12 remains above the 15-minute EMA20 and EMA50 (both $0.11) and EMA200 ($0.10), so the short-term structure has not broken, but it is clearly losing steam.
This is exactly the kind of timeframe disagreement worth calling out explicitly: the daily and hourly charts are aligned on trend direction, but the 15-minute momentum is already rolling over. That tension typically resolves one of two ways — either the higher timeframes pull the short-term momentum back up as buyers step back in near support, or the short-term weakness is an early tell for a deeper pullback that eventually shows up on the hourly and daily charts too. Right now, the 15-minute chart is best used for execution timing rather than as a directional signal on its own: watching for a reaction near the $0.11 pivot and EMA zone tells you more than trying to read direction from this timeframe alone.
Bullish scenario for $HBAR
The bullish case for $HBAR rests on holding above the daily pivot at $0.11, which would keep the path toward $0.13 resistance open and signal that demand is real despite overbought readings. If $HBAR can hold above the daily pivot at $0.11 and avoid a decisive break of the EMA20 support zone, the path of least resistance stays up, with R1 at $0.13 as the next reasonable target. A daily close that absorbs the current overbought pressure without breaking down would be a strong signal that demand is genuine and not just short-covering — particularly notable given the broader market cap contracted 4.02% over the last day while $HBAR pushed higher. Continued risk appetite, reflected in the Fear & Greed reading of 74, would need to persist for this scenario to play out cleanly.
What would invalidate this: A daily close back below the S1 level at $0.10, or a clean break through the 1H EMA20 and EMA50 cluster at $0.10, would undercut the bullish case and open the door toward the daily EMA20 near $0.09.
Bearish scenario for $HBAR
The bearish case draws strength from exhaustion signals stacked across timeframes, with overbought RSI readings and price trading outside upper Bollinger Bands on both daily and hourly charts pointing toward a likely mean-reversion pullback. An RSI of 79 on the daily and 86.72 on the hourly, combined with price trading outside the upper Bollinger Band on both charts, is the kind of setup that often precedes a mean-reversion move — even inside an otherwise healthy uptrend. If the broader market’s 4.02% drawdown continues to weigh on risk sentiment, $HBAR could get pulled back toward the daily EMA20 at $0.09 or the Bollinger mid-band, unwinding some of the recent extension.
What would invalidate this: A hold above the 1H EMA20 at $0.10 with RSI cooling gradually rather than breaking down sharply, alongside the MACD histogram staying positive, would suggest the pullback is shallow and the uptrend structure remains intact rather than reversing.
Positioning and risk
The honest read here is that Hedera crypto is in a stretched, momentum-driven state where the trend and the exhaustion signals are both valid at the same time — that is the tension traders need to sit with rather than resolve prematurely. The daily chart defines the macro bias as bullish but extended; the hourly chart confirms the trend while flashing its own overbought warning; and the 15-minute chart is already showing early signs of momentum fatigue. None of that guarantees a reversal, but it does mean chasing strength here carries a different risk profile than it did lower down in the move.
That said, volatility, as reflected in the ATR readings, is elevated relative to $HBAR’s price level, and the broader market backdrop — a 4.02% pullback in total capitalization even as sentiment reads as Greed — adds a layer of macro uncertainty that should not be ignored. This is a moment that calls for discipline around key levels like the $0.11 pivot and $0.10 support rather than conviction in either direction, and for treating both the bullish and bearish scenarios outlined above as live possibilities until price actually confirms one of them.
FAQ
What does an overbought RSI mean for $HBAR right now?
An overbought RSI — currently at 79.02 on the daily and 86.72 on the hourly chart — does not guarantee an immediate reversal but signals that the asset is statistically extended. It indicates that the easy, low-risk entries are behind the market and that the probability of a pause or pullback toward the EMA20 near $0.09 has increased, especially since the broader crypto market has already contracted 4.02%.
Can $HBAR maintain its uptrend during a broader market pullback?
It is possible but challenging. $HBAR pushed higher even as total crypto market capitalization fell 4.02% to $2.87 trillion, which shows relative strength. However, sustained divergence from the broader market is rare, and if the pullback deepens, the stacked overbought signals across daily and hourly timeframes increase the likelihood that $HBAR eventually catches down toward its moving averages.
What are the key support and resistance levels for $HBAR right now?
The immediate levels to watch are the daily pivot at $0.11, resistance (R1) at $0.13, and support (S1) at $0.10. Below S1, the daily EMA20 at $0.09 serves as the next significant support. On the hourly chart, the EMA20 and EMA50 cluster at $0.10 is also a critical short-term level that would need to hold for the bullish structure to remain intact.
Disclaimer: This article is for informational purposes only and does not constitute financial advice, an investment recommendation, or a solicitation to buy or sell any financial instrument or cryptocurrency. The analysis provided is not indicative of future results. Investing in crypto assets and financial markets carries a high risk of capital loss. Always do your own research (DYOR) and consult a qualified financial advisor before making any decision.
Article produced with the assistance of artificial intelligence and reviewed by the editorial team.

 en.cryptonomist.ch