Kamino Finance [KMNO] gains 17% – Why bulls should watch THIS indicator
ambcrypto.com
26 September 2026 17:50, UTC
Kamino Finance [$KMNO] delivered an impressive rally in the past day, with 17% in accrued value during this period. This extends its performance over the past couple of weeks, during which gains surged notably.
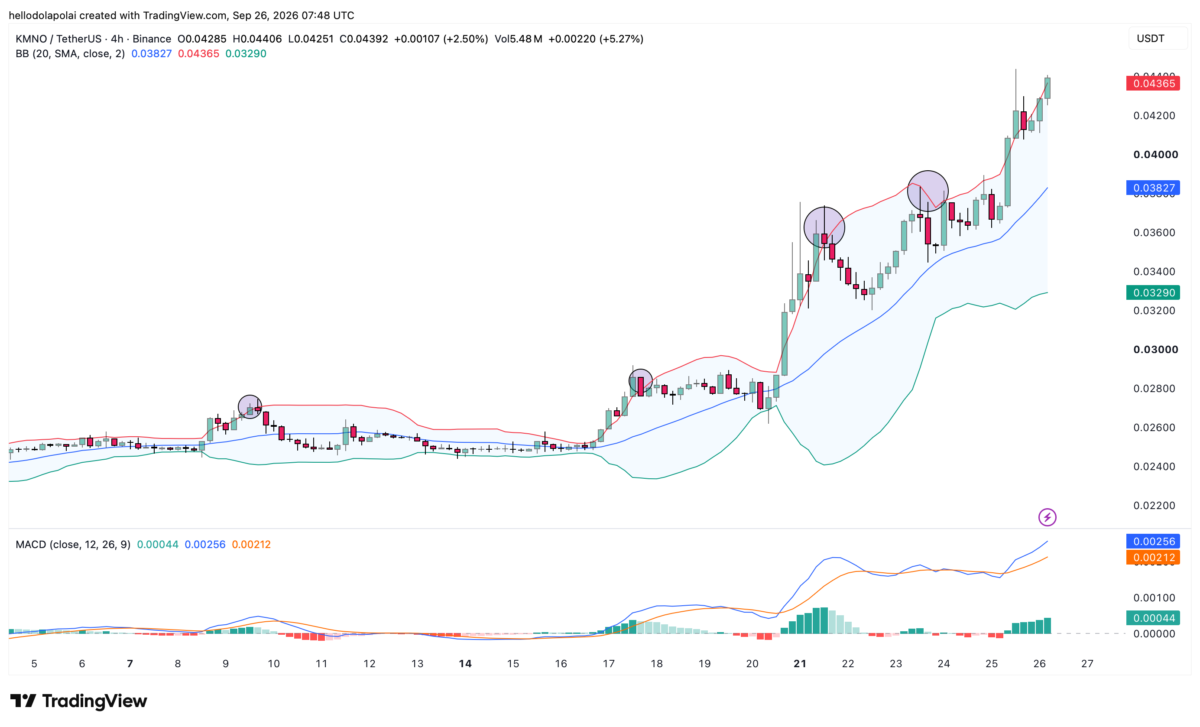
Chart analysis using the Bollinger Bands, however, paints a bigger picture, showing that $KMNO is now in the overbought territory. That’s the upper Bollinger Band line in red.
The overbought region on the chart implies that there’s a high risk of a decline when price trades into this zone, as traders are paying more than the asset’s fair value. In the past four instances where price had traded into the upper band, there had been a decline to the mid-band level, in blue.
Know when your coins move
Alerts, real-time prices, and market news — all in one app
Point your phone camera to install
4.8 based on 40K reviews in the App Store and Google Play
Source: TradingView
Market momentum supports the upward move for the asset, with the Moving Average Convergence Divergence (MACD) seeing a rally to the upside while maintaining a strong position on the positive side.
The positive side of the market suggests that traders are heavily accumulating the asset, regardless of the warning that price is now overvalued.
$KMNO’s on-chain growth strengthens the bull case
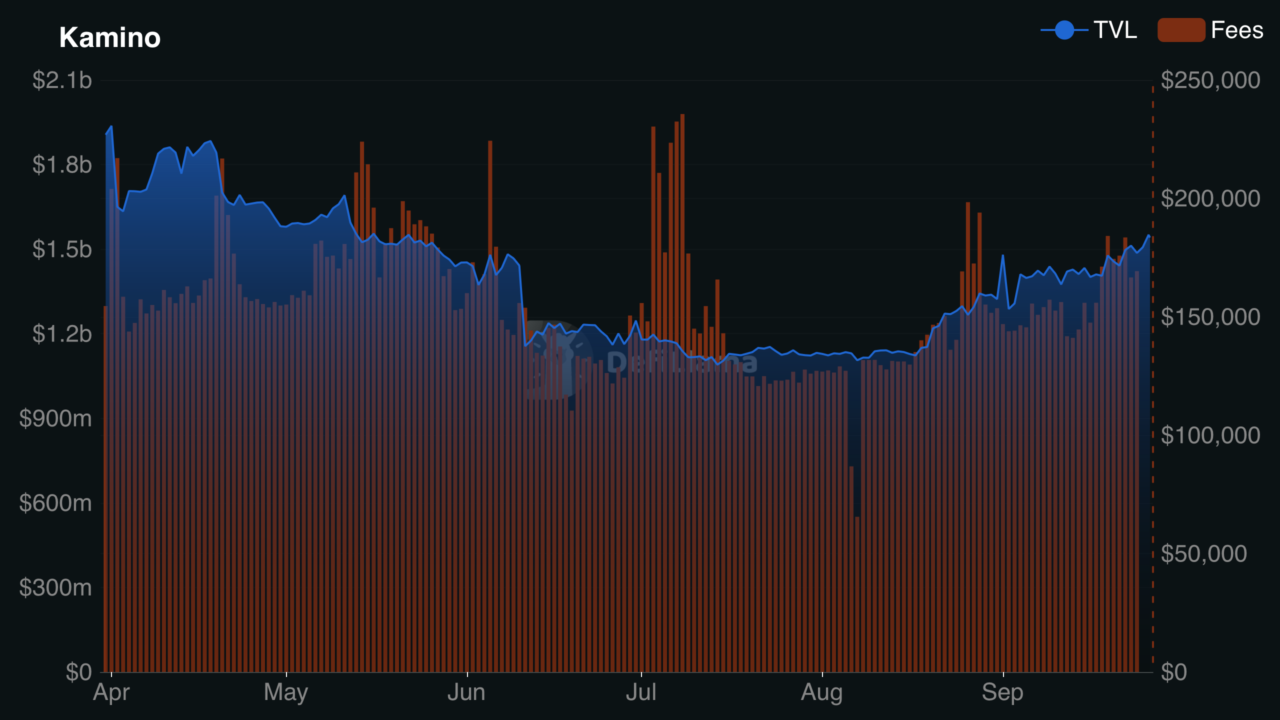
The on-chain flow in the market now suggests that the bullish sentiment isn’t just speculation, with activity on-chain backing its utility. According to DeFiLlama data, the Total Value Locked (TVL) has surged by over $253 million since September 2, reaching roughly $1.541 billion presently.
The surge in this TVL is a reflection of users in the market committing funds to earn APY as they anticipate long-term price appreciation. At the same time, the fees generated on the protocol have maintained steady growth, with over $169,000 reported as of the latest reading.
Source: DeFiLlama
When the protocol maintains steady fee generation, traders continue to use it, which can support a positive outlook for its price.
Spot flows point to continued accumulation
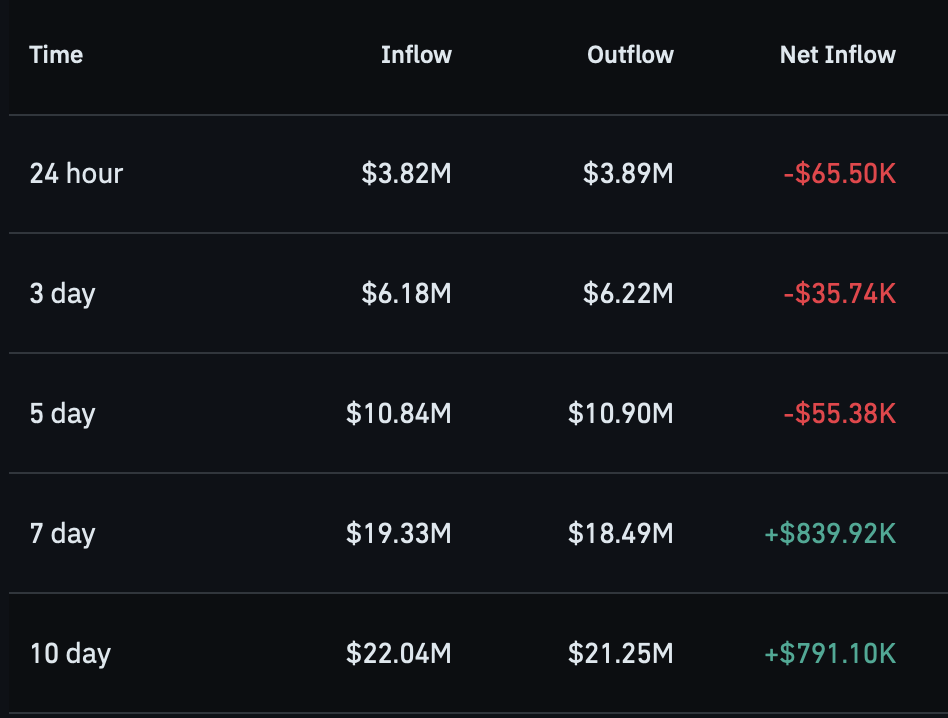
Spot trades have continued to back the price move through accumulation. There’s a marked accumulation when the Spot Netflow turns negative. CoinGlass Netflow analysis of spot traders shows that there’s been roughly $65,000 in net accumulation following a $3.5 million buy.
While this is negative, the gap between spot buyers and sellers remains slim, which means sellers can overcome buyers within that period, hence forcing the asset lower.
Source: CoinGlass
Overall, the risk hasn’t been limited. A change in Spot Flow can be a signal to confirm whether investors are deciding to offload their assets, tallying with the bearish outlook.
Final Summary
$KMNO’s 17% rally has pushed the token into the overbought zone, raising the risk of a pullback toward the mid-Bollinger Band.
On-chain activity and Spot Netflow continue to support accumulation, with TVL reaching $1.541 billion and roughly $65,000 in net spot accumulation.

 ambcrypto.com