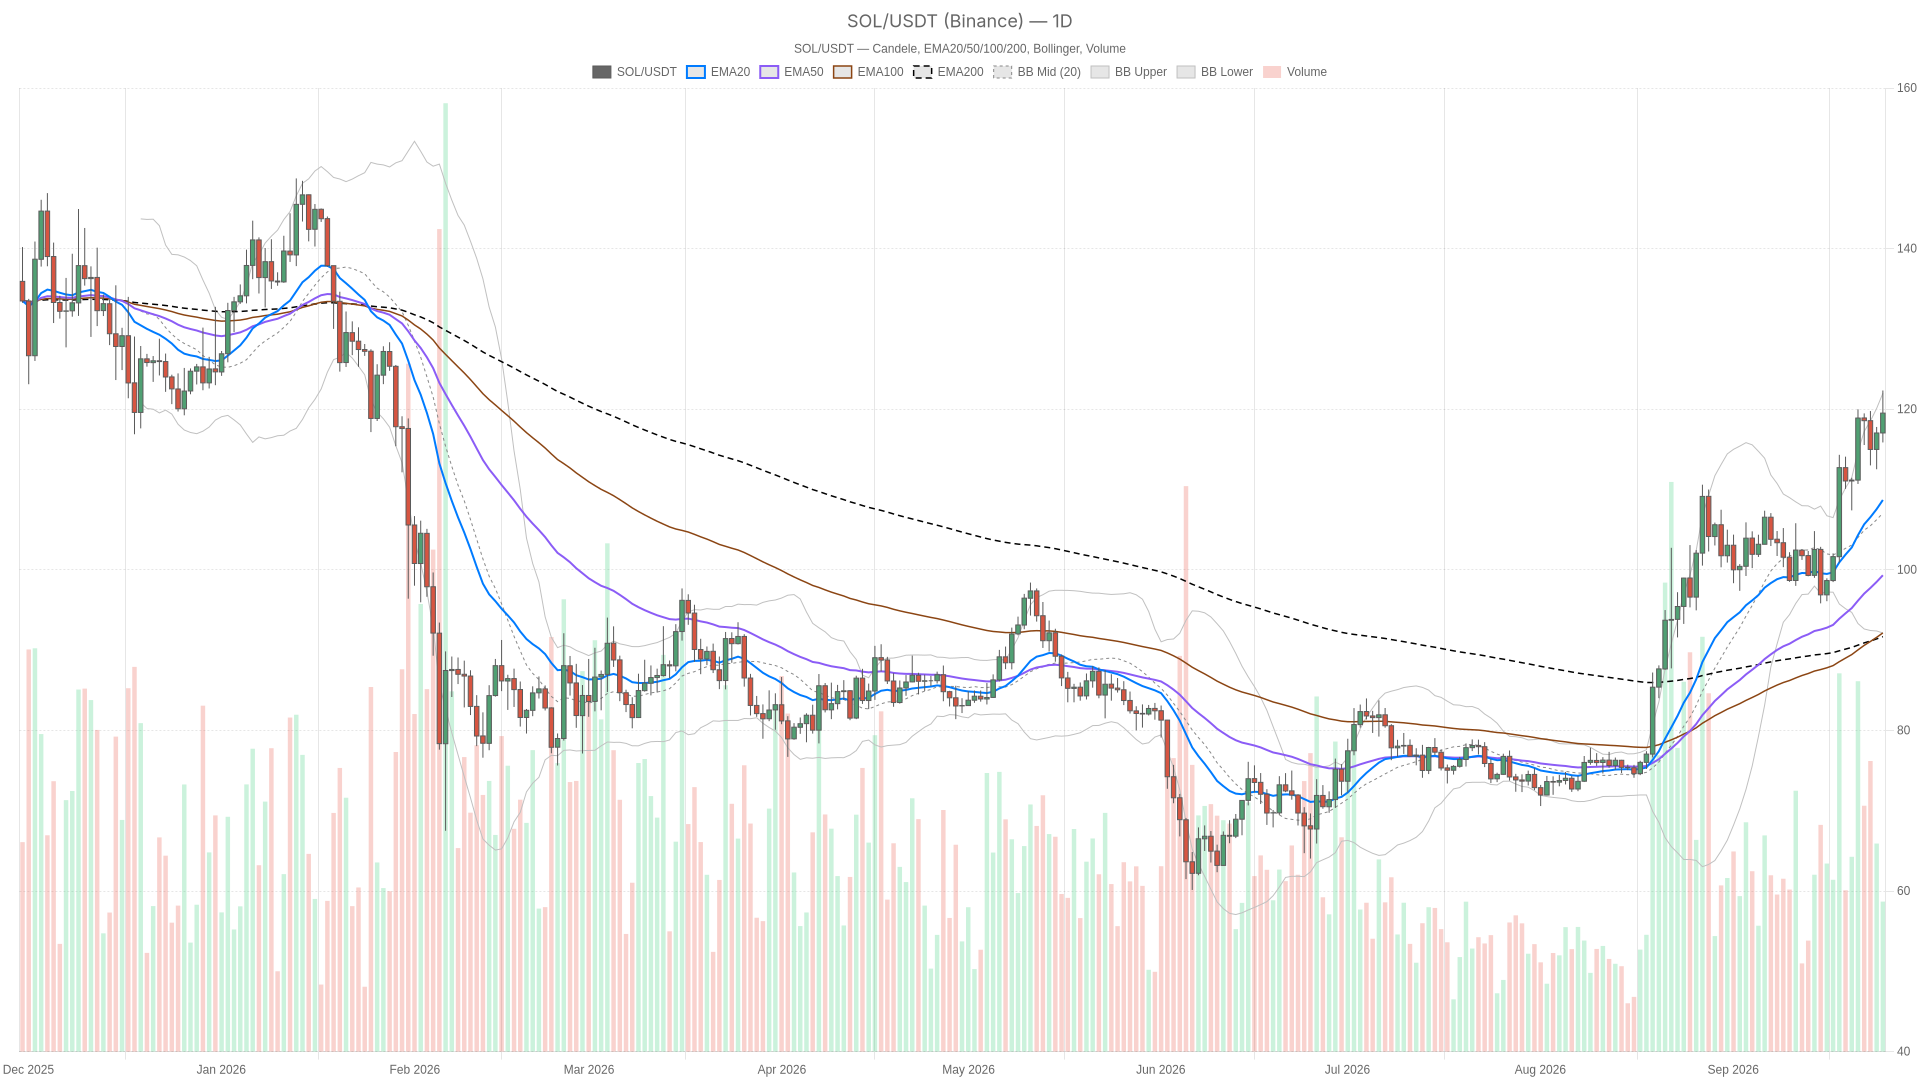
Daily Structure: $SOL Still in a Clean Uptrend
On the daily timeframe the regime is unambiguously bullish. Price at $119.51 sits above the EMA20 ($108.70), EMA50 ($99.32) and EMA200 ($91.67), and all three averages are stacked in the correct bullish order with clear separation between them. That kind of spacing typically signals a trend that has been running for a while without much interference — buyers have been in control structurally, not just recently.
Meanwhile, the RSI14 on the daily sits at 67.49, reflecting strong momentum that has not yet entered the stretched territory above 70 where exhaustion moves tend to appear. The daily MACD confirms this: the line at 5.79 sits comfortably above the signal at 4.77, with a positive histogram of 1.01. Momentum is still expanding, not rolling over — for now.
Furthermore, the Bollinger Bands add useful context. With the mid-band at $107.06 and the upper band at $121.98, price is riding close to the top of its volatility envelope. That pattern is typical of a trending market rather than one that is mean-reverting — price hugging the upper band usually means the trend remains the path of least resistance. Daily ATR14 at 5.5 confirms a market with real range, where multi-dollar swings are normal rather than a warning sign.
Daily pivots frame the immediate battle: the pivot point at $119.23 sits almost exactly where price is trading, with resistance at $122.61 (R1) and support at $116.14 (S1). In short, $SOL is trading right on the fence between continuation and consolidation.
1H and 15m: Where the $SOL Rally Starts Losing Steam
The hourly chart still calls itself bullish, and structurally it agrees with the daily — EMA20 ($117.47), EMA50 ($116.63) and EMA200 ($112.77) are all stacked correctly beneath price at $119.40. However, the intensity is fading. RSI14 on the 1H is 63.81, healthy but noticeably cooler than the daily reading, and the MACD histogram has shrunk to 0.32 from the daily’s 1.01. That is a smaller, less convincing push.
Moreover, price is trading just below the hourly pivot of $119.98, with resistance at $120.59 and support at $118.79. It has not yet reclaimed the level that would confirm the next leg higher. Drop to the 15-minute chart and the deceleration becomes even clearer — RSI14 sits at 55.98, essentially neutral, with none of the conviction visible on the higher timeframes. The MACD histogram has thinned out to just 0.11, meaning momentum on this execution timeframe is nearly flat.
This is the tension worth naming: the daily trend is intact and strong, the hourly trend agrees but with visibly less force, and the 15-minute chart shows the rally pausing for breath right at resistance. None of this invalidates the bullish daily bias on its own, but it does mean chasing strength at current levels carries more risk than it would have a few sessions ago.
Market Backdrop: Dominance, Sentiment and DEX Activity
Bitcoin dominance stands at 58.27% of a $2.913 trillion total crypto market, per CoinGecko-derived figures, while $SOL’s own share of that market cap is 2.44%. With that much capital still concentrated in BTC, sustained upside in Solana crypto typically needs either a rotation out of Bitcoin or fresh capital entering altcoins specifically — something the current dominance reading does not yet confirm is happening at scale.
Activity across the DEX ecosystem is mixed rather than uniformly strong. PumpSwap fees have fallen sharply — down 50.49% in a day, 59.38% over a week, and 76.45% over the past month. HumidiFi, by contrast, saw fees spike 289.09% in a single day even as its 7-day figure remains down 32.42%. Orca DEX fees dropped 12.38% daily but are up 88.26% over seven days, while Raydium AMM fees fell 29.97% on the day yet sit up 43.48% over the past month. Taken together, this does not read as declining network usage so much as fee flow rotating between platforms — on-chain activity remains active even if it is not concentrated in one place.
Bullish Scenario
If $SOL reclaims the hourly pivot at $119.98 and pushes through the daily R1 at $122.61, the next real test becomes the daily upper Bollinger Band near $121.98. A break above that level with expanding volume and a re-accelerating MACD histogram on the 1H and 15m would suggest the daily trend still has fuel. Confirmation would come from RSI climbing back above 60 on the shorter timeframes rather than stalling in the mid-50s. This scenario gets invalidated if price fails to hold above the daily pivot ($119.23) and slips back beneath the hourly EMA50 ($116.63).
Bearish / Mean-Reversion Scenario
The cooling momentum visible on the 1H and 15m charts is the strongest argument for a pullback. A break below the hourly EMA20 ($117.47) and the daily pivot ($119.23) would open the door toward the daily S1 at $116.14, with the daily Bollinger mid-band at $107.06 serving as a deeper, more structural target if selling pressure builds. The daily RSI at 67.49, while not extreme, still leaves room for a mean-reversion move if buyers simply stop showing up at these levels. This scenario is invalidated if price reclaims and closes above the daily upper band with the MACD histogram expanding again.
Positioning and Risk
Right now the asset occupies a genuinely two-sided spot: the daily trend still belongs to the bulls, but the shorter timeframes are asking for patience rather than aggression. Daily ATR at 5.5 and hourly ATR at 1.21 both point to a market capable of moving fast in either direction. Meanwhile, a Fear & Greed reading of 71 means sentiment is already leaning euphoric — historically a backdrop where sharp pullbacks can appear without much warning even inside an intact uptrend. The gap between daily conviction and 15-minute hesitation is real, and treating this as a one-directional certainty in either direction would mean ignoring what the charts are actually showing.
FAQ
Is $SOL’s daily trend still bullish?
The daily structure remains unambiguously bullish as of September 25, 2026. Price at $119.51 sits above all three key EMAs — EMA20 at $108.70, EMA50 at $99.32, and EMA200 at $91.67 — stacked in proper bullish order. The daily MACD histogram remains positive at 1.01, confirming that momentum is still expanding rather than rolling over.
What are the key resistance levels $SOL needs to clear?
The immediate hurdle is the hourly pivot at $119.98, followed by the daily R1 at $122.61 and the daily upper Bollinger Band near $121.98. A confirmed close above these levels with expanding volume and a re-accelerating MACD histogram on shorter timeframes would signal the next leg higher.
Why is short-term momentum cooling despite a strong daily setup?
The 15-minute RSI14 sits at 55.98 — nearly neutral — and the MACD histogram has thinned to just 0.11, indicating the rally is pausing for breath at resistance. This deceleration does not invalidate the daily bullish bias, but it suggests that chasing strength at current levels carries more risk than it did a few sessions ago. A broader market dip of -0.50% in total crypto cap also contributes to the hesitation.
Disclaimer: This article is for informational purposes only and does not constitute financial advice, an investment recommendation, or a solicitation to buy or sell any financial instrument or cryptocurrency. The analysis provided is not indicative of future results. Investing in crypto assets and financial markets carries a high risk of capital loss. Always do your own research (DYOR) and consult a qualified financial advisor before making any decision.
Article produced with the assistance of artificial intelligence and reviewed by the editorial team.

 en.cryptonomist.ch