
 invezz.com

Bitget confirmed that unauthorised transfers were detected from some of its hot wallets at 18:31 UTC on Sept. 24, with an estimated $351.6 million affected.
The exchange said the breach was limited to portions of its hot and warm wallet infrastructure, while cold wallets remained secure and user losses were covered by its $464 million protection fund.
$BNB was trading near $775 at the time of writing, little changed over the past 24 hours and up roughly 2.5% over the previous seven days.
The token had climbed from below $750 on Sept. 18 to above $800 on Sept. 22 before giving back part of the move.
Selling had therefore started before the Bitget breach. $BNB slipped below $760 on Sept. 24 before recovering towards $780, where buyers have so far struggled to push the price higher.
The hack has introduced uncertainty over the supply that could reach the market. Addresses receiving stolen assets have carried out onchain swaps, leaving traders watching for further movement of $BNB controlled by the attacker.
The incident did not involve a breach of $BNB Chain itself, according to Bitget's account of the attack, which identified its own wallet infrastructure as the affected system.
Price action since the incident has remained contained between the Sept. 24 low and the $780 area, suggesting the initial selling has not been enough to break $BNB's recent support.
A larger amount of stolen $BNB reaching exchanges or decentralised markets could, however, increase available supply while the token is still trading below $800.
Network activity provides some support on the other side. $BNB Chain's total value locked reached roughly $5.8 billion during the week ending Sept. 6, while decentralised exchange volume rose to $9.21 billion.
$BNB Smart Chain has been operating under its Pasteur upgrade since Aug. 25.
$BNB Chain reported that BidBlock V2 accounted for roughly 98% of blocks during its latest three day observation window and carried 28% more gas per block on average than the previous Bid V1 system.
Tokenised assets have grown on the network as well.
OpenEden brought its TBILL and HYBOND fixed income products to $BNB Chain on Sept. 17, while real world asset value on the network had risen from $509.72 million in September 2025 to roughly $5.69 billion this month, according to figures cited by OpenEden from RWA.xyz.
US investors have had access to regulated $BNB exposure through VanEck's $BNB ETF since May.
The fund held 3,496 $BNB and had $2.5 million in net assets as of Sept. 10, leaving its size small compared with $BNB's overall market.
$BNB price analysis
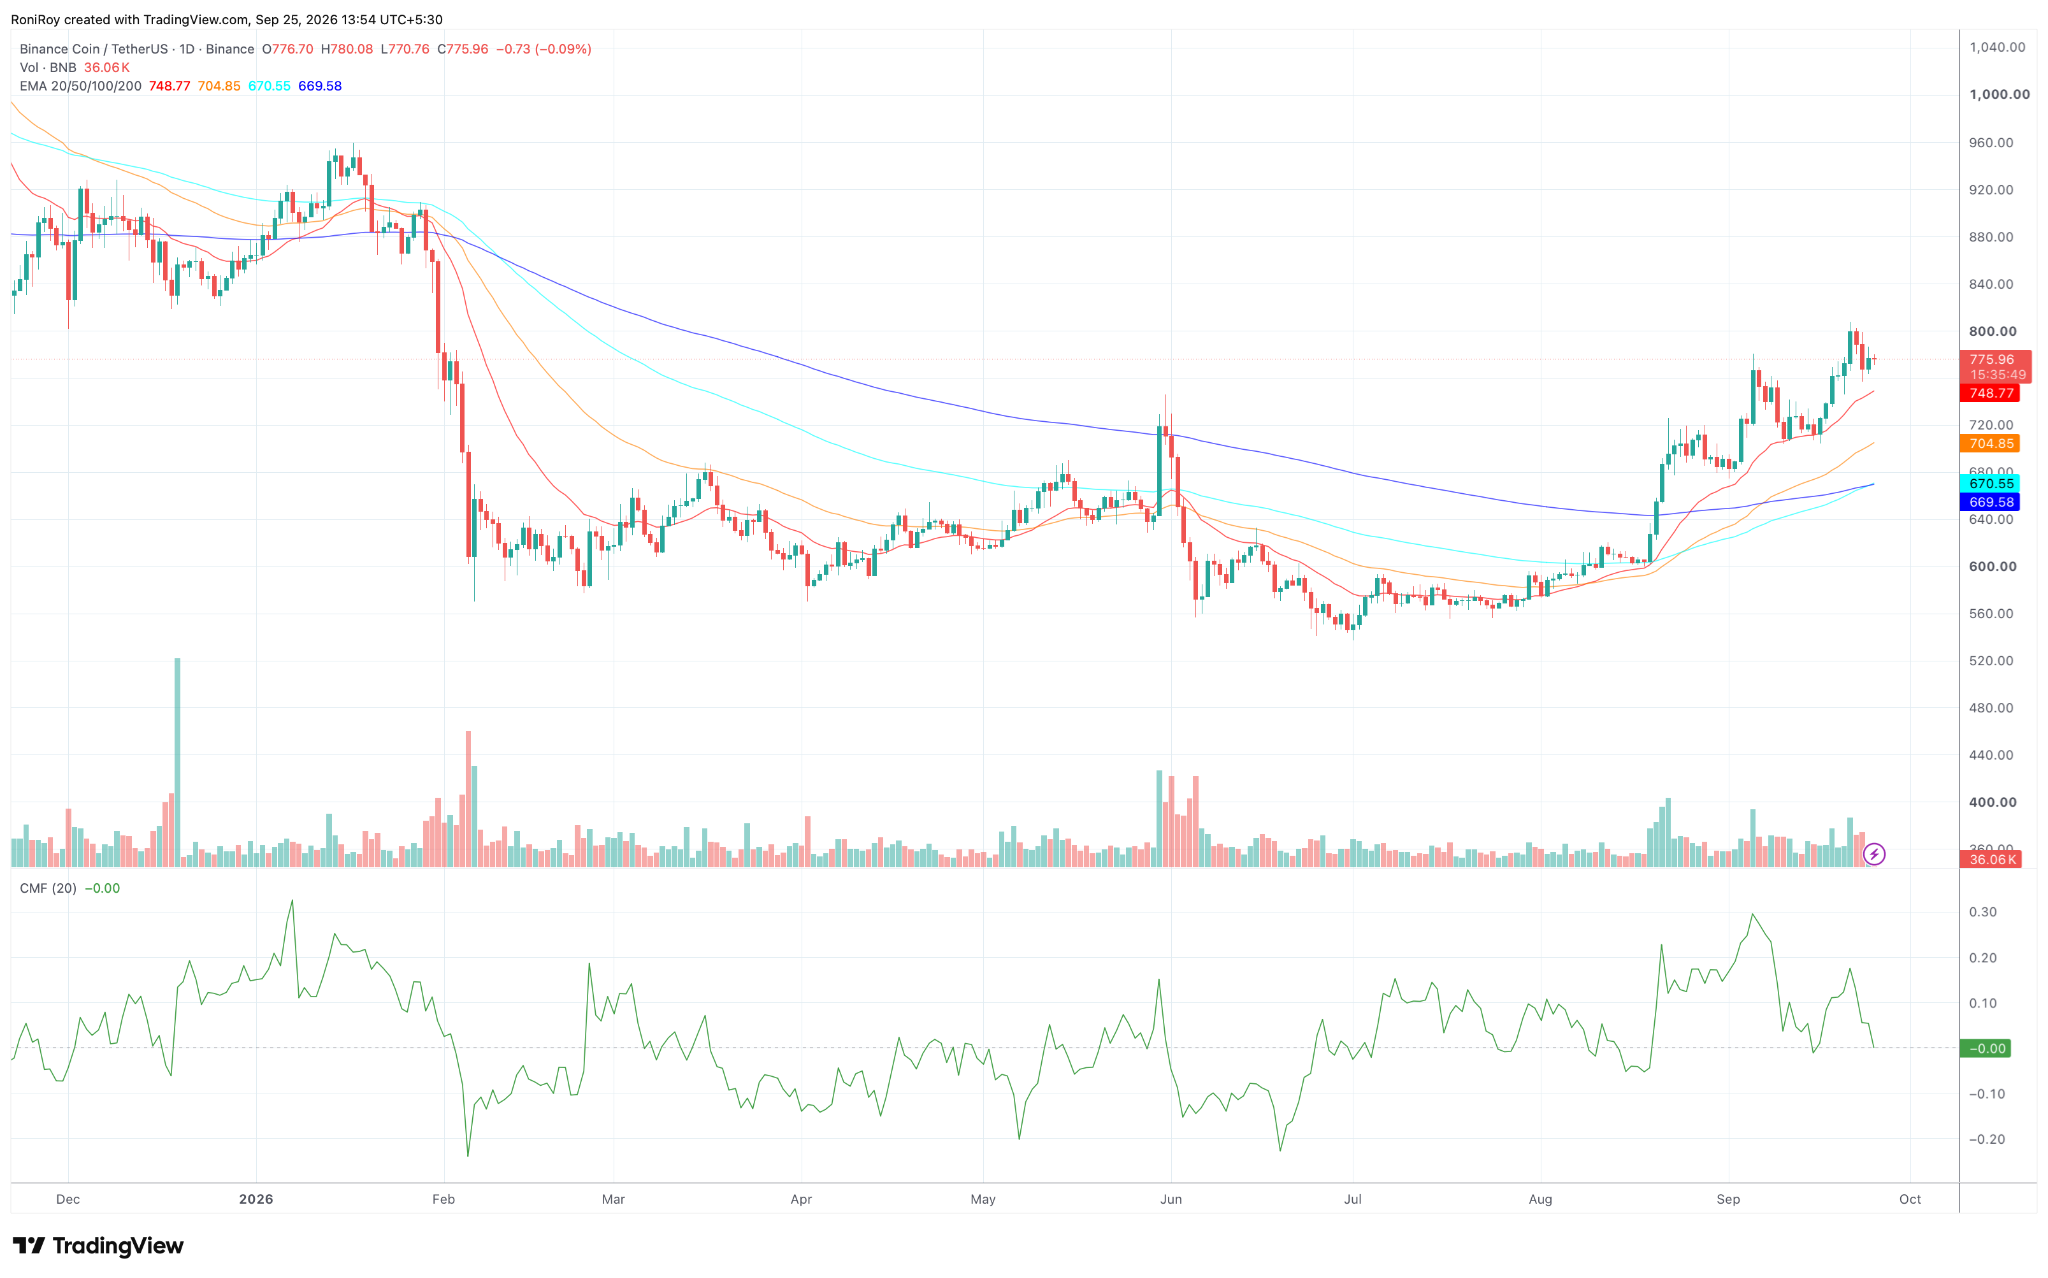
$BNB's daily structure remains above its main moving averages despite the pullback from $800.
At roughly $776, the token trades above the 20-day exponential moving average at $748.77, the 50-day EMA at $704.85, the 100-day EMA at $670.55 and the 200-day EMA at $669.58.
$BNB/$USDT 1-day price chart. Source: TradingView.
The 20-day EMA has climbed above the longer averages and is now the closest dynamic support.
Price has remained nearly $27 above it, leaving the $748 to $750 area as an important downside level if the current range breaks.
A daily close below $748 would put the recent breakout structure under pressure and could expose the next support around $720.
If selling continues below that level, the 50 day EMA near $705 would become the next probable target.
Chaikin Money Flow has weakened at the same time. CMF has fallen from above 0.20 earlier in September to around zero, meaning the strong buying pressure that accompanied $BNB's move towards $800 has largely faded.
A move below zero would indicate that selling volume is beginning to outweigh buying volume, increasing the risk of a retest of the 20-day EMA.
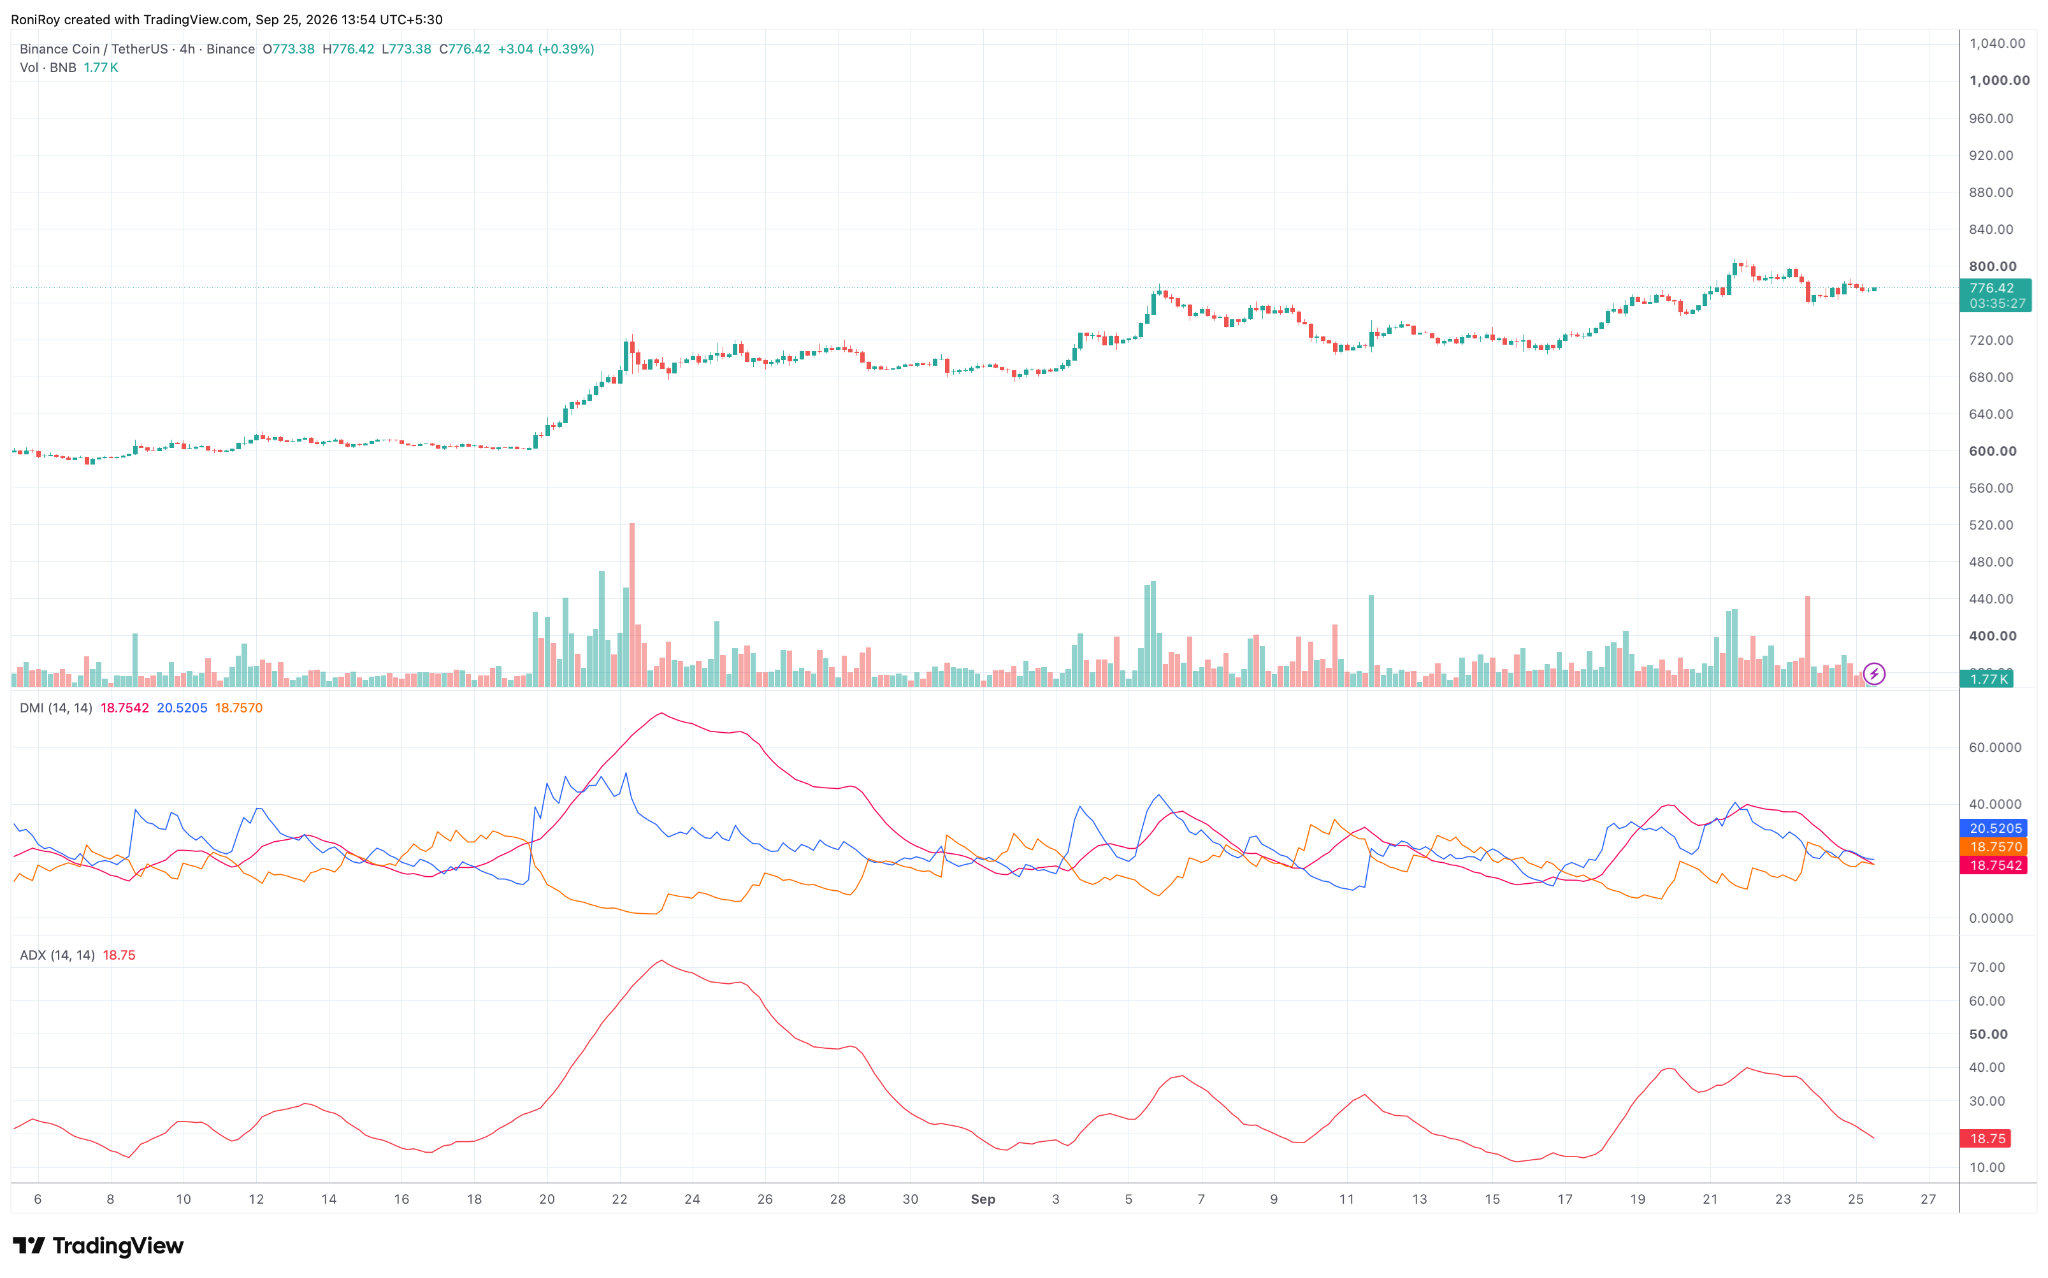
The 4-hour chart shows why $BNB has struggled to establish direction around $775.
The Directional Movement Index has +DI at 20.52 and −DI at 18.76, leaving buyers with only a small advantage. See below.
$BNB/$USDT 4-hour price chart. Source: TradingView.
ADX has dropped to 18.75 after trading near 40 earlier this month.
A reading below 20 points to weak trend strength, which fits with $BNB moving sideways between roughly $760 and $800 over recent sessions.
For the downside case to gain traction, −DI would need to move above +DI while ADX rises back through 20.
A break below $760 would then expose the daily 20 EMA around $749, followed by $720 and $705.
$BNB faces resistance around $780 to $800 in the opposite direction.
A sustained break above $800 would clear the September high and open room towards the $840 area, where price traded before its steep February selloff.