
 crypto.news

Solana price rebounded to about $116 on Sep. 24 after falling from a recent high near $120. The recovery put $SOL back above a key 4-hour trend indicator, but the daily chart shows price approaching resistance where the latest rally stalled.
Solana price recovers from $112.52 low
Solana daily chart showed $SOL price at $116.05 on Sep. 24, up 0.92% from its daily open of $114.99. Price had reached $116.63 after touching $112.52 earlier in the session. The move followed a retreat from the roughly $120 high reached during the preceding rally.
The latest decline interrupted a sharp advance from below $100 in mid-September. $SOL remains above the daily Bollinger Band midpoint at $106.19, though it has pulled back from the upper band at $119.90. The space between price and the midpoint shows how far the recent rally carried $SOL; it does not establish whether the next move will be a deeper correction or another test of $120.
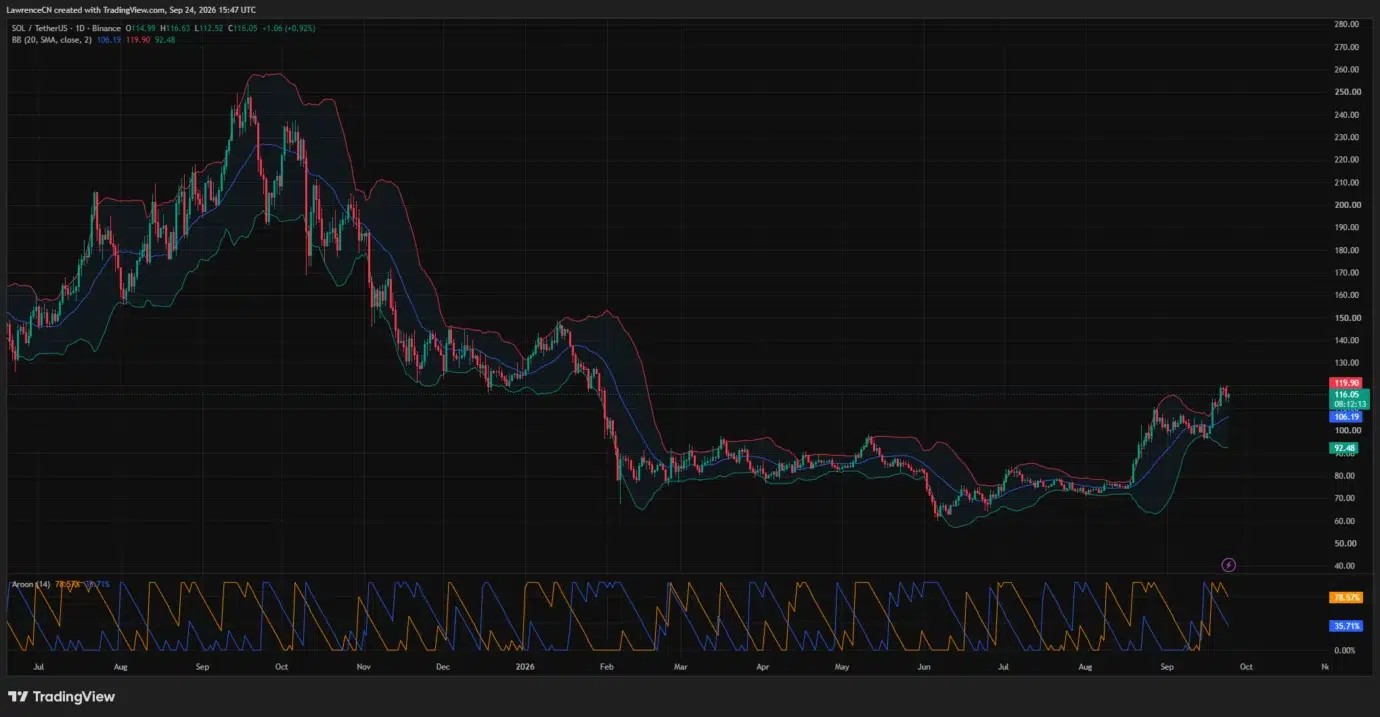
The daily Aroon readings were 78.57% and 35.71% on the TradingView chart, reflecting a strong recent upside move alongside the pullback. Buyers would need to clear the recent high to extend that move. A further retreat would bring the $110 area into view before the Bollinger midpoint near $106.
The price dip came after the rally met resistance near $120, but the charts alone cannot establish how much of the selling came from profit-taking or forced closures of leveraged positions. The distinction matters because a liquidation heatmap maps estimated positions at risk; it does not measure how much was actually liquidated.
The 4-hour chart keeps $112.38 in focus
On TradingView’s 4-hour chart, $SOL recovered to $116.07 after briefly trading near $113. The Supertrend line stood at $112.38 beneath price, leaving the short-term signal bullish despite the drop from $120. A sustained move below that line would weaken the current 4-hour setup.
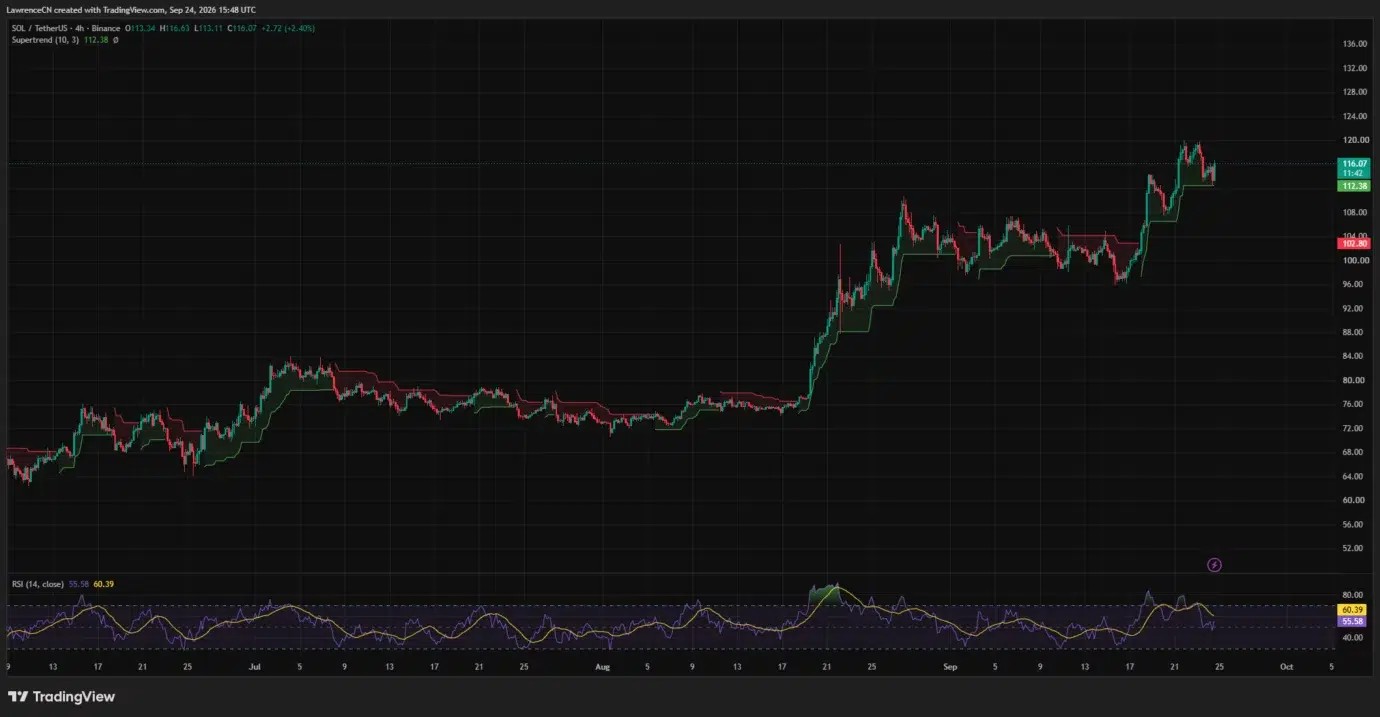
The 4-hour relative strength index stood at 55.58, below its moving average of 60.39. RSI had eased from its recent highs, indicating that upside momentum cooled during the pullback even as the indicator stayed above the neutral 50 mark.
A return toward $119.90–$120 would test both the daily upper Bollinger Band and the area where sellers halted the latest advance. If $SOL fails to hold $112.38, traders may look next to $110, a level identified by market analyst AltCryptoGems as important to the bullish structure. The analyst warned that a break below it could expose a gap toward $96; that is a scenario, not a confirmed price target.
Crypto Patel offered a wider view of the trend, placing a higher-timeframe resistance zone at $138–$149 and a structural level at $148.73. Those levels remain well above the immediate $120 test and would become more relevant only if $SOL first extends its current recovery.
Solana SMC Analysis: Break Above $148.73 Could Confirm a Major CHoCH
— Crypto Patel (@CryptoPatel) September 24, 2026
On the HTF chart, $SOL is approaching a critical HTF supply zone at $138–$149, where a major Bearish Order Block remains unfilled.
The broader structure is still defined by a Lower High, but the recent… pic.twitter.com/TZnL08kmwA
CoinGlass heatmap places the largest nearby cluster at $120
CoinGlass’s three-day $SOL liquidation heatmap showed a bright band of estimated leveraged positions around $120, above the roughly $116 price shown at the chart’s right edge. Smaller bands appeared around $117–$118, while estimated positions also clustered below price near $112–$113.
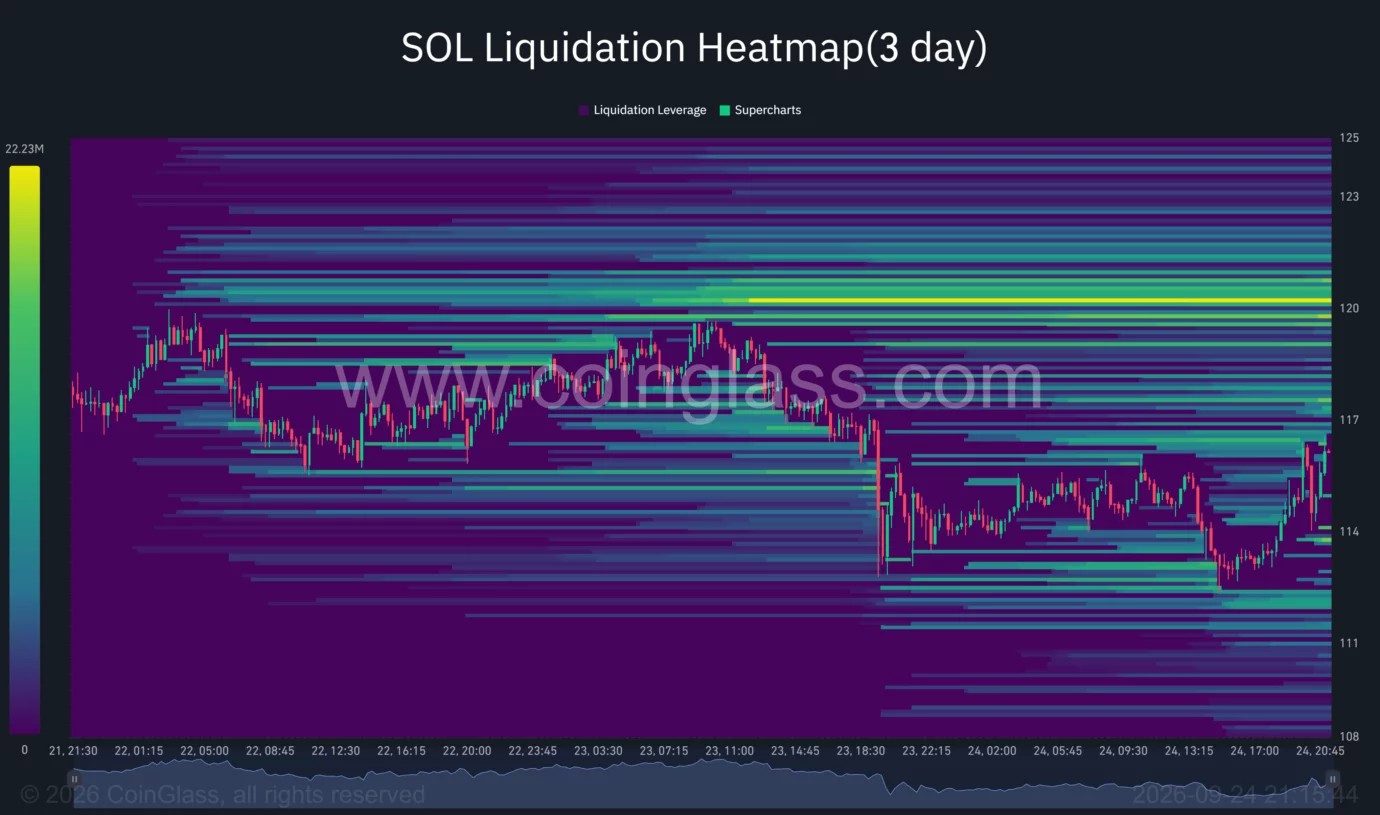
A move into any of those bands could trigger position closures, but the heatmap cannot show that price will reach them. The recent slide through $114 and rebound toward $116 demonstrate why both sides of the market remain exposed to quick moves around nearby levels.
The heatmap also shows $SOL trading near $119 on Sep. 22 and 23 before falling toward $112–$113 on Sep. 24. Price then recovered by the end of the displayed period. The separate daily chart was captured later and put $SOL near $116, so its session gain should not be confused with the decline from the earlier $120 high.
US policy remains a backdrop, not a confirmed cause
The US Senate failed to advance the Digital Asset Market Clarity Act on Sep. 15 in a 49–50 procedural vote. The bill would have set a statutory framework for oversight of digital assets. Its failure remains relevant to US crypto investors, although the vote occurred more than a week before $SOL’s latest retreat and does not by itself explain the Sep. 24 move.
The Federal Reserve raised its target interest-rate range by a quarter point to 3.75%–4% on Sep. 16. The decision is another part of the US market backdrop, but the available price and liquidation charts do not establish a direct link between that decision and Thursday’s Solana pullback.
For now, the nearer signals are on the charts: $SOL held the $112 area after its intraday drop, while $119.90–$120 remains the first resistance to clear. A break on either side would give traders a clearer test of whether the rebound can continue.