
 thecryptobasic.com

Cardano’s recovery from $0.1382 has brought $ADA closer to the upper boundary of its descending channel, but the three-day price structure has yet to confirm an upside breakout.
Cardano traded at approximately $0.2353 at on September 24, according to Binance’s market data. $ADA was down 5.75% over the preceding 24 hours, with prices ranging between $0.2339 and $0.2501. That short-term decline comes while the broader three-day structure remains above its earlier low.
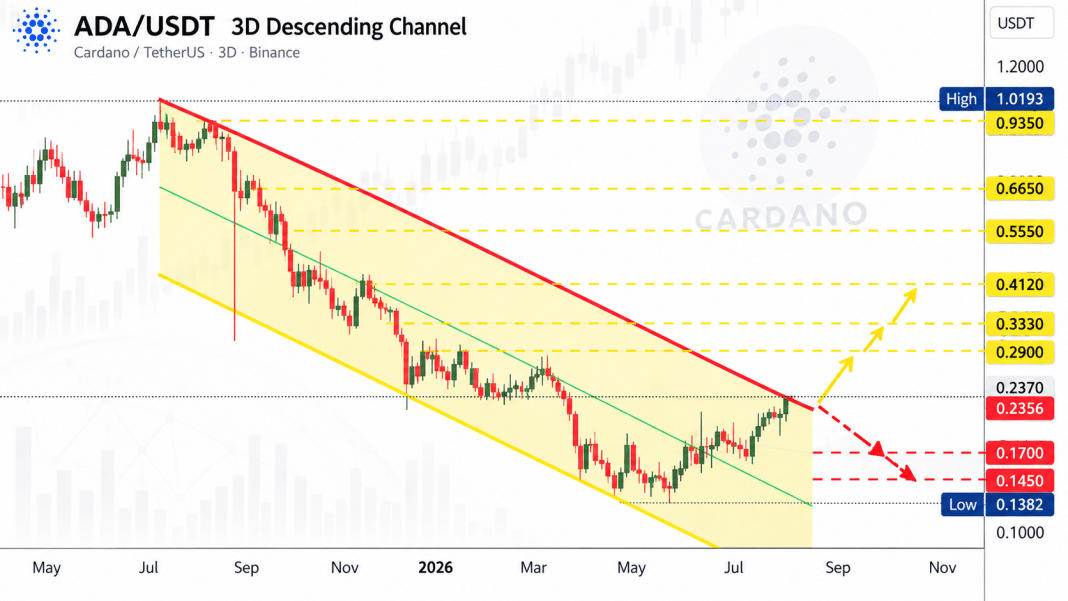
Cardano Recovers Within Its Descending Channel
The three-day $ADA/USDT structure traces a prolonged decline from the second half of 2025. Two downward-sloping boundaries frame the move, with the upper trendline marking resistance and the lower trendline tracking the channel’s support boundary.
$ADA has moved away from the lower portion of that structure following its decline to $0.1382. Subsequent candles have established higher local lows and carried price above the channel’s midpoint, represented by the green diagonal line. However, the recovery remains beneath the upper resistance boundary.
At the three-day chart’s $0.2356 reading, $ADA stands approximately 70.5% above the low, but remains about 76.9% below the earlier $1.0193 peak. These calculations show the difference between recovering from a depressed price and reversing the broader decline. The rebound has changed $ADA’s position within the channel without yet producing an exit from it.
$0.29 Is the First Horizontal Barrier Above Channel Resistance
The immediate structural test is the descending upper trendline. A completed three-day candle above that boundary would mark an initial upside breakout on this timeframe. Holding above the boundary afterward would provide additional evidence that the move is more than a temporary excursion outside the channel.
The $0.2900 level is a separate horizontal resistance—not the exact location of the declining channel ceiling. Because the trendline slopes downward, its price changes over time. $ADA would first need to clear that diagonal boundary before confronting the marked $0.2900 barrier.
A move from $0.2356 to $0.2900 would represent an increase of approximately 23.1%. Beyond that level, the next resistance references are $0.3330 and $0.4120, equivalent to gains of approximately 41.3% and 74.9% from the same starting price. These are distances to technical levels, rather than forecasts that $ADA will reach them.
Further overhead barriers appear at $0.5550, $0.6650 and $0.9350. They become relevant to an extended recovery only after price overcomes the nearer resistance levels.
Trading volume would also matter during any breakout attempt. A resistance break accompanied by above-average volume generally carries more technical significance than one occurring on low volume, although neither guarantees continued gains.
$0.2370 Needs Reclaiming Before Serving as Support
The immediate price pivot is around $0.2370. With the three-day reading slightly below that level, it cannot yet be described as firmly established support. A recovery above it, followed by sustained trading or a successful retest, would provide stronger evidence of support formation.
If $ADA retreats from the upper channel boundary, the recent trading area around $0.19–$0.20 provides an initial downside reference. Below that, the earlier recovery structure identifies potential support near $0.1700, followed by the $0.1450–$0.1382 region surrounding the previous low.
A rejection at resistance would not, by itself, confirm a return to $0.1382. That scenario would require price to lose the intervening support areas. Conversely, the existing recovery remains an advance within a descending channel until $ADA closes above its upper boundary.