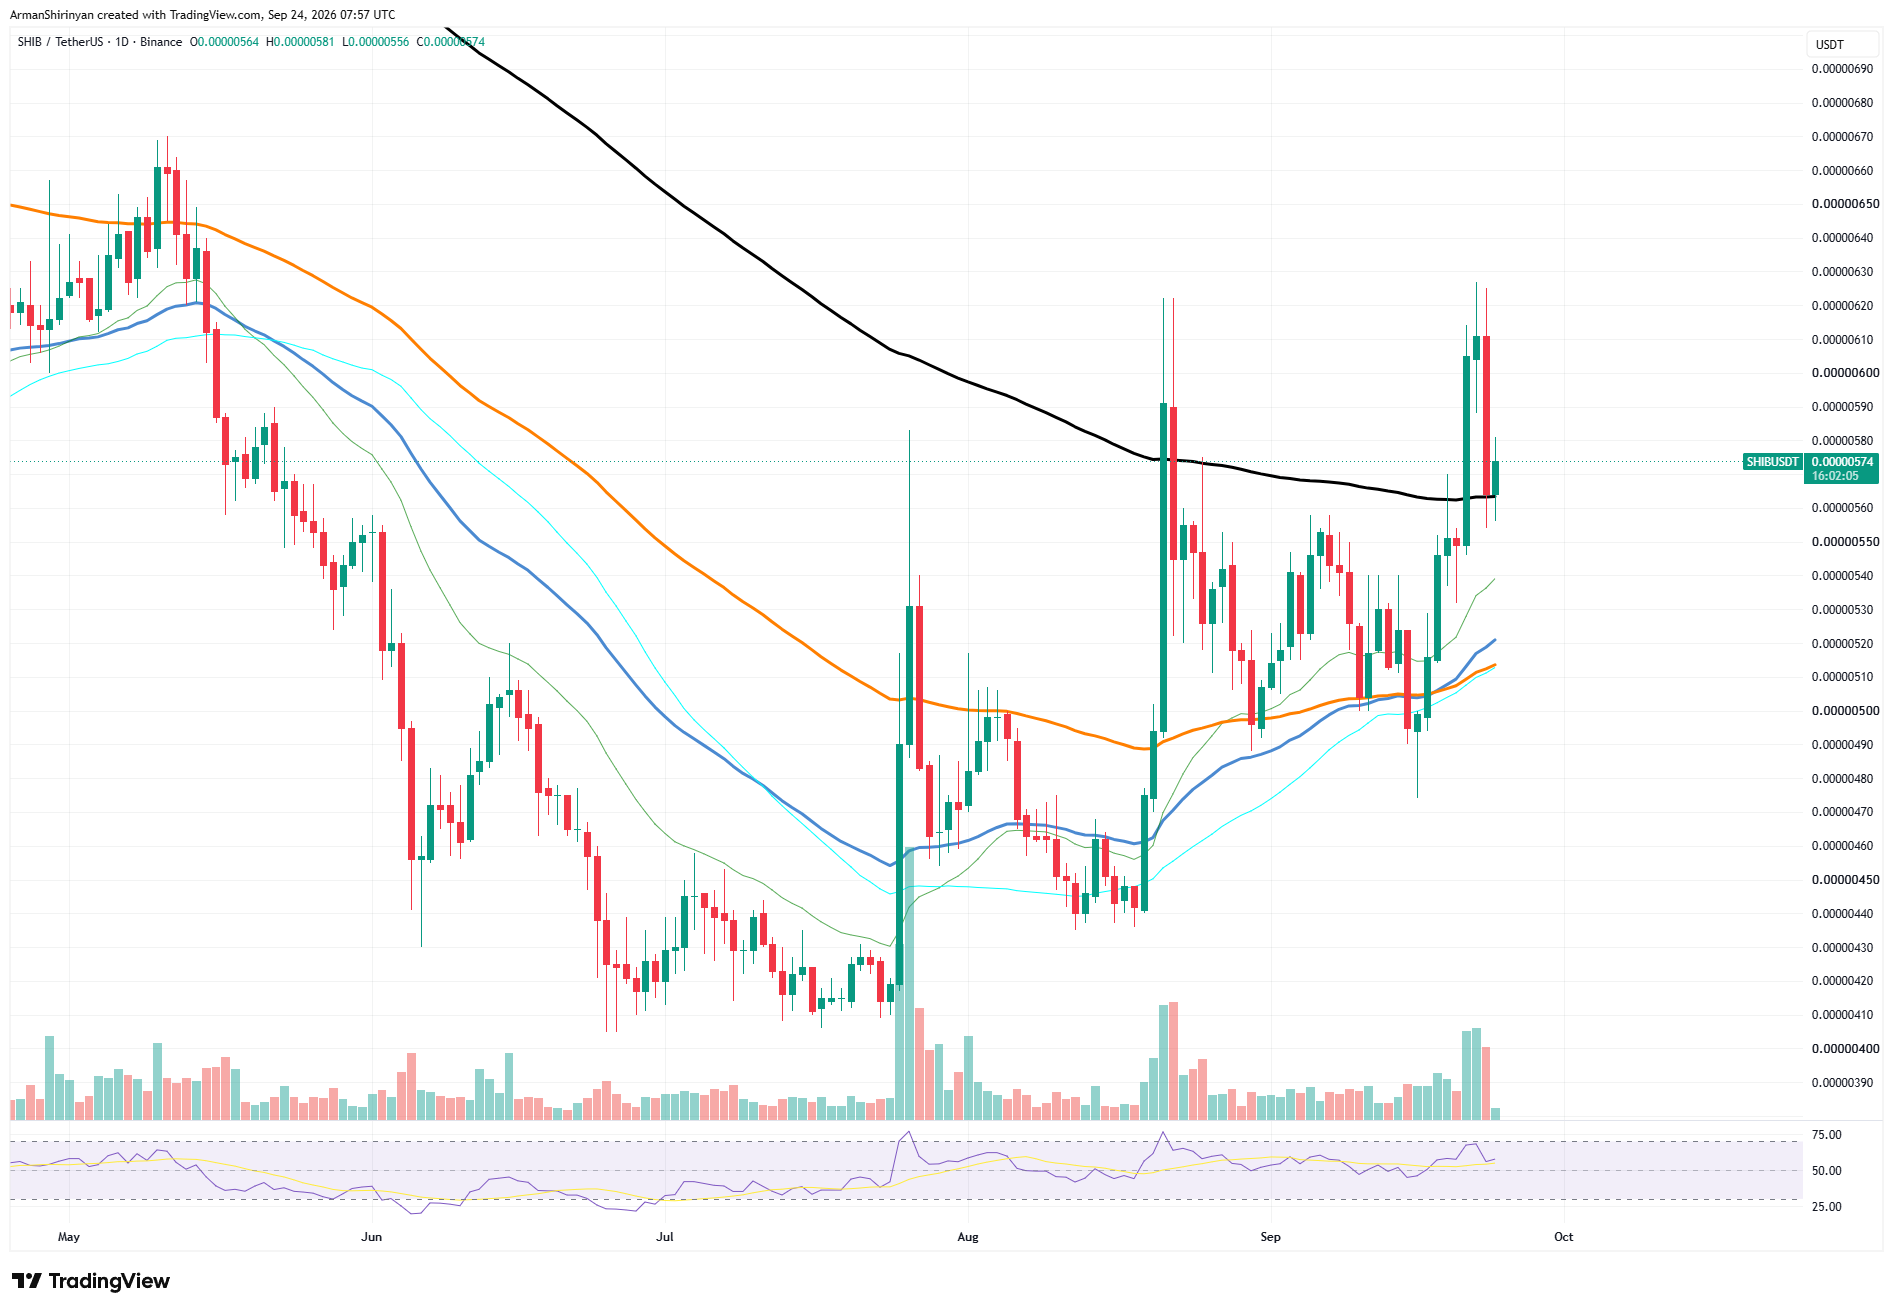
Instead, sellers showed up aggressively above $0.0000060. The rejection indicates that there is still a significant amount of overhead supply in the market between $0.0000060 and $0.0000063. One encouraging aspect is that $SHIB has not given up the 200-day moving average entirely. The token is currently trading slightly above it at about $0.00000573.
Additionally, the most recent daily candle indicates that buyers are responding to the initial decline toward approximately $0.00000555. The most crucial area to watch next is therefore the $0.0000055–$0.0000057 region.
Can decline disrupt the uptrend?
The 10% decline could turn into a retest rather than a total breakout failure if $SHIB stabilizes above the 200-day EMA and then recovers $0.0000058. In that case, $0.0000060 and $0.0000062 would once more become the immediate resistance targets. A significantly weaker setup would result from losing the 200-day average.
Following a dense cluster of shorter moving averages around $0.0000051–$0.0000052, $SHIB's first significant support is located around $0.0000054. Additionally, momentum has quickly decreased. After approaching overbought territory during the rally, the RSI fell back toward the middle of its range.
This alleviates some overheating, but it also demonstrates the significant decline in bullish momentum. As a result, $SHIB is right at a technical decision point. The larger recovery structure would be maintained if $0.0000056 holds. The most recent spike above $0.0000060 would appear more and more like a failed breakout if the price continues to move below it.

 u.today