
 thecryptobasic.com

$XRP Trades Near Key Long-Term Levels as Macro Chart Maps Path Toward $8.
$XRP is trading around $1.49, down about 5.1% over the past 24 hours, according to CoinMarketCap. The token has traded between approximately $1.49 and $1.65 during the period, with a market capitalization of about $93.6 billion and 24-hour volume of roughly $8.42 billion.
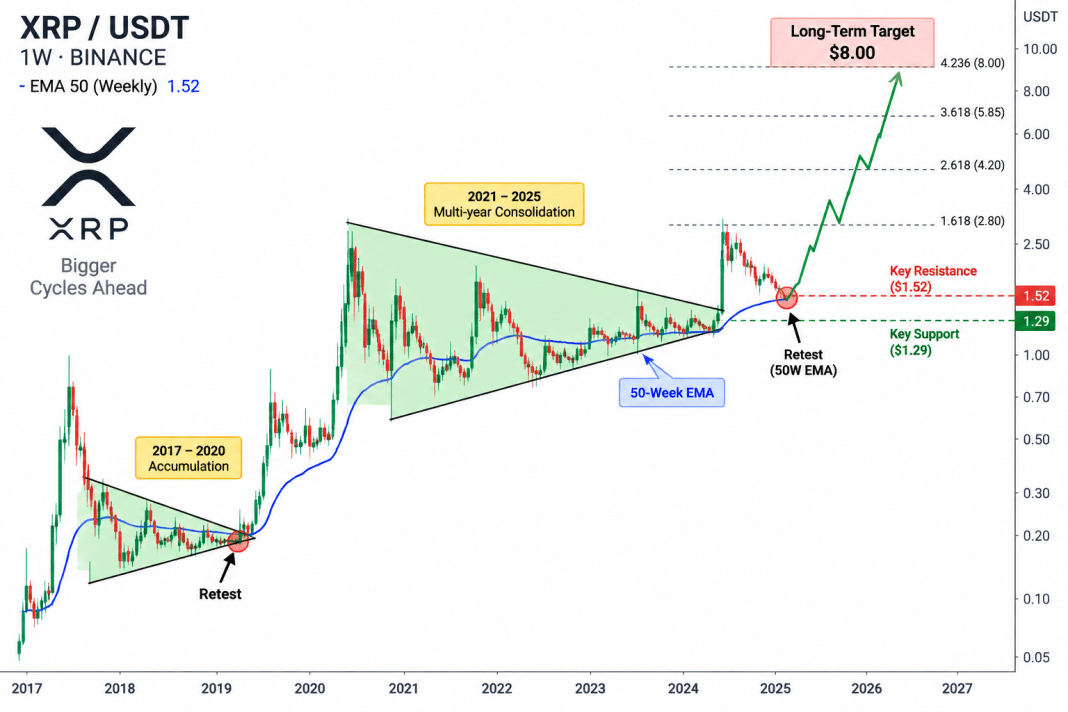
The latest price action places $XRP back around a technical region highlighted in the long-term chart. The structure focuses on multi-year consolidation, repeated compression patterns, Fibonacci-derived levels, and the 50-week exponential moving average (EMA).
Long-Term $XRP Structure
The chart compares two large consolidation structures. In the earlier cycle, $XRP spent an extended period compressing inside converging support and resistance before breaking higher. After the breakout, price returned toward the former compression boundary for a retest, followed by a substantial upward expansion.
The larger structure shown on the right follows a similar sequence on a much longer timeframe. $XRP formed another broad contracting formation, subsequently moved outside that structure, and is now shown in the chart’s retest phase.
This is the central point of the chart: the current pullback is occurring after the larger multi-year compression was broken, rather than while $XRP remains inside that original structure.
50-Week EMA Is the Central Technical Test
The most important feature in this $XRP chart is the 50-week exponential moving average (50W EMA). The chart presents the current market structure as a battle around this long-term trend measure after $XRP’s 2026 decline.
An EMA gives greater weight to recent prices than a simple moving average. On a weekly chart, the 50W EMA therefore represents roughly one year of price history while responding more quickly to recent changes. In this chart, it separates the current recovery/retest from a confirmed return to the larger upward structure.
$1.29, $1.52 and the 50-Week EMA
The analysis identifies approximately $1.29 as an important support region and around $1.52 as a significant resistance area, alongside the ongoing test of the 50-week EMA.
With $XRP currently around $1.49, price is only about 2% below $1.52 and roughly 15.5% above $1.29.
The chart describes 2026 as the convergence period for these long-term technical structures. Its projected path shows $XRP completing the retest before moving toward a group of higher horizontal Fibonacci-extension levels.
Fibonacci Levels Map the Longer-Term $XRP Targets
The chart also uses Fibonacci extension levels to map the projected price zones above the current structure. The first major extension shown is the 1.618 level near $2.80, followed by the 2.618 extension around $4.20 and the 3.618 level near $5.85. The upper 4.236 extension corresponds to approximately $8.00, which forms the chart’s longer-term projected target.
These Fibonacci levels sit above the immediate $1.52 resistance and 50-week EMA area. Therefore, the chart’s sequence is structured as 50-week EMA/$1.52 test → $2.80 → $4.20 → $5.85 → $8.00. The higher Fibonacci levels are projected technical levels rather than prices $XRP has already reached in the current move.
From the current CoinMarketCap price of approximately $1.49, reaching $8 would represent a gain of about 437%, equivalent to approximately 5.37 times the current price.
The $8 level is a technical projection shown by the macro chart, not completed price action. At present, the measurable structure consists of $XRP trading near $1.49, while the chart’s previously identified $1.29 support, $1.52 resistance, and 50-week EMA remain the immediate long-term reference points.