
 invezz.com

Dogecoin ($DOGE) steadied around $0.10 on Tuesday after a 19% rally over the past seven days.
The rally carried the meme coin above a descending resistance trendline and several closely watched moving averages, improving its near-term technical outlook.
Demand through $DOGE-focused exchange-traded funds also increased. The products recorded $909,650 in net inflows on Monday, according to SoSoValue data.
While that marks a notable rise from the $284,510 recorded on September 15, $DOGE still faces a significant chart test: buyers need to establish a sustained break above the supply zone stretching from $0.10000 to $0.10219.
The combination of stronger price action and positive fund flows has given bulls a clearer case for further gains. Momentum indicators, however, suggest the rally may be stretched after its rapid advance.
$DOGE ETF inflows rise as the crypto market recovers
Dogecoin-focused ETFs attracted $909,650 on Monday, more than three times the $284,510 in inflows reported for September 15.
The increase points to renewed interest in $DOGE through investment products as the broader cryptocurrency market rebounds.
Traders will be watching whether the funds continue to attract capital in the coming sessions, particularly if $DOGE moves decisively above $0.10.
Positive flows may also draw attention from traders who follow institutional investment products.
That interest could support trading activity, though ETF inflows do not necessarily translate into an immediate or proportional rise in $DOGE’s price.
The size and persistence of demand matter more than one positive reading.
For now, the fund data adds to the evidence of improving sentiment behind Dogecoin’s recovery.
The more immediate question is whether buyers can maintain that interest as the token tests an area where selling previously limited gains.
Dogecoin technical outlook: $DOGE breaks descending trendline
$DOGE’s 19% rise pushed it above a descending resistance trendline near $0.09110. That level had marked a barrier during the preceding decline.
Once price moved through it, the trendline became a potential support level that traders may revisit if the rally pauses.
The token also trades above its major daily exponential moving averages. The 50-day EMA stands near $0.08365, the 100-day EMA near $0.08350, and the 200-day EMA near $0.09256.
Trading above all three gives $DOGE a stronger technical footing than it had before the breakout.
The 200-day average is especially relevant to the immediate outlook because it sits between the current price and the former descending trendline.
Together, the $0.09256 average and the $0.09110 breakout level form an area where buyers could try to defend recent gains if $DOGE retreats from $0.10.
A successful retest would show that buyers remain active after Monday’s sharp move. A drop back below those levels, by contrast, would weaken the breakout and shift attention toward the lower moving averages.
Daily momentum indicators support the recent advance.
The Moving Average Convergence Divergence indicator, or MACD, has crossed above its signal line, while its histogram has expanded in positive territory. Both developments indicate that upward momentum has strengthened.
The Relative Strength Index tells a more cautious story about the pace of the move.
At 67, the daily RSI sits just below overbought territory, suggesting that the token could rally higher in the near term.
Dogecoin is testing a supply zone between $0.10000 and $0.10219. The lower boundary is a round-number level, while $0.10219 marks the upper edge of the area identified in the original chart analysis.
Moving briefly above $0.10 would therefore be less convincing than sustaining a break beyond the entire zone.
If $DOGE clears $0.10219 and holds above it, the next resistance range lies between $0.11619 and $0.11732.
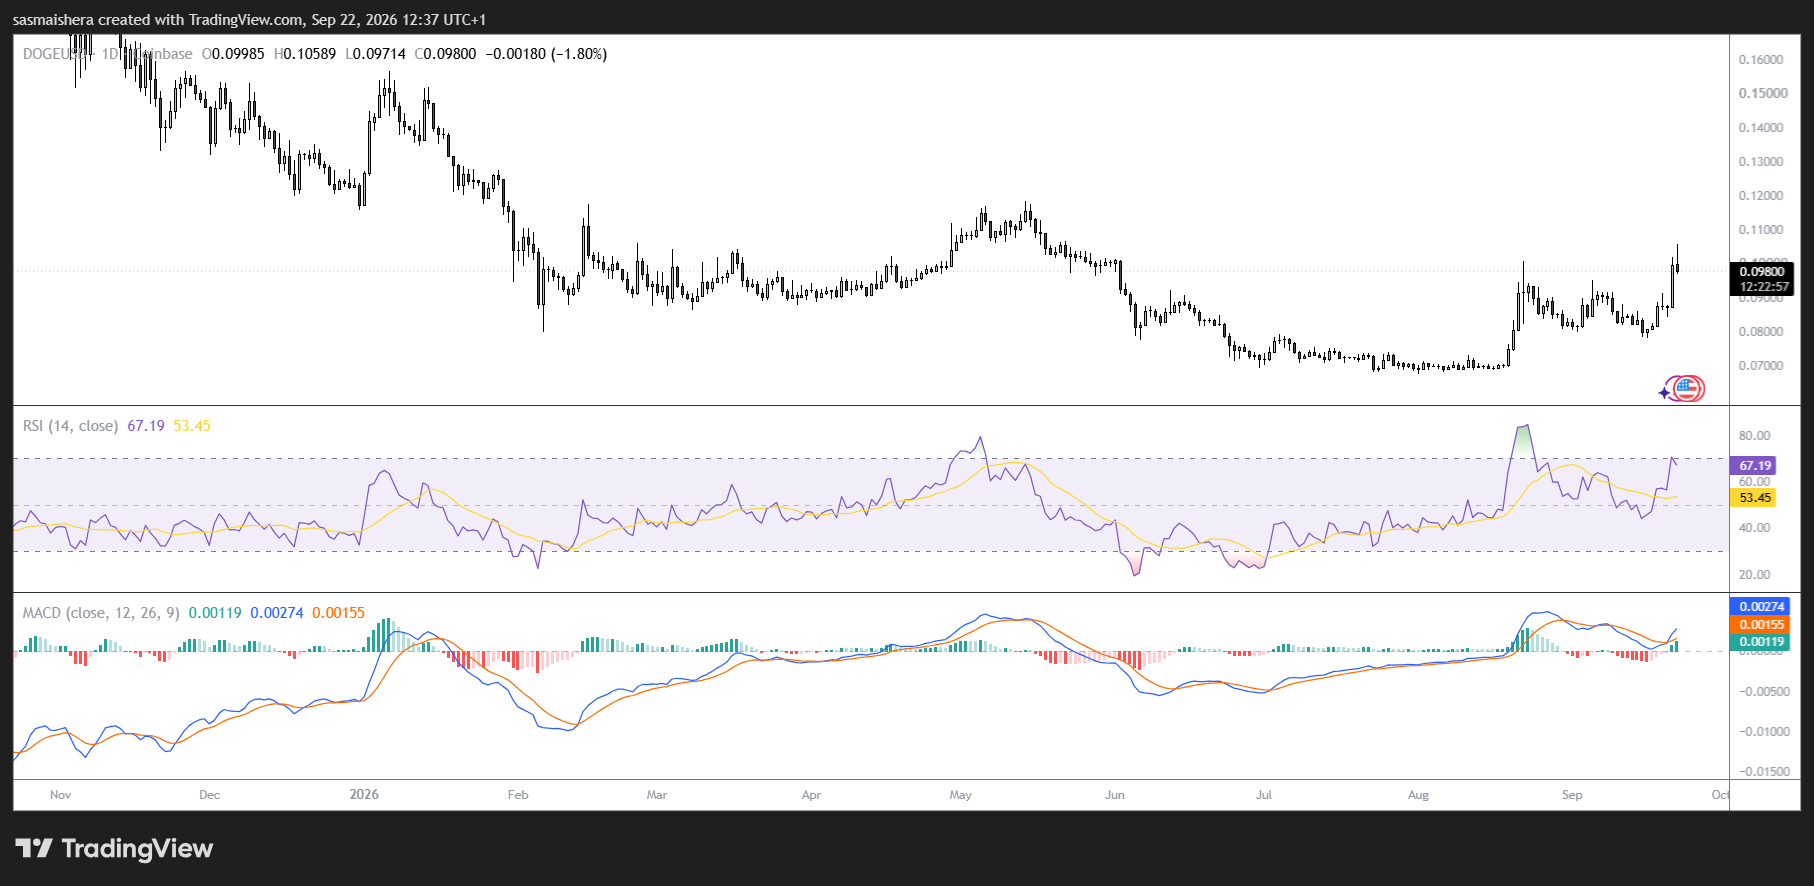
That would represent a further advance from the current consolidation area, although the target depends on buyers maintaining pressure after the initial breakout.
However, if $DOGE cannot clear the supply zone, the first area to watch on a pullback is the 200-day EMA near $0.09256.
The former descending trendline around $0.09110 sits just below it.
Those levels could show whether traders view a decline as an opportunity to buy or as a sign that Monday’s gains are fading.
A deeper retreat would bring the 50-day and 100-day EMAs near $0.08365 and $0.08350 into focus.
That closely grouped pair provides another potential support area, but reaching it would mean $DOGE had surrendered much of its recent advance.