
 invezz.com

Solana price has climbed towards the $120 level as US spot $SOL exchange traded funds extended their net inflow streak to 12 consecutive weeks and demand from corporate treasuries continued to absorb the token.
According to CoinGecko, $SOL traded near $116.46 at press time, up 3.3% over the past 24 hours and 15.7% over the past seven days.
The token briefly approached $120 after recovering from below $100 last week and has gained 26.2% over the past 30 days.
US spot Solana ETFs recorded $26.1 million in net inflows on Sept. 21, according to SoSoValue.
Bitwise's BSOL accounted for $14.44 million, while Grayscale's GSOL attracted $7.8 million.
The latest inflows extended a run that has lasted for 12 consecutive weeks.
Solana ETFs have attracted roughly $1.44 billion in cumulative net inflows and held approximately $1.74 billion in net assets as of Sept. 21.
During the week ending Sept. 18, the products drew $60.7 million, their largest weekly inflow during the 12 week streak.
At the same time, multiple public companies have been accumulating $SOL.
For instance, DeFi Development Corp. disclosed on Sept. 21 that it had accumulated approximately 101,381 $SOL since Sept. 14, increasing its holdings by 4.24% within a week.
Its treasury now holds approximately 2.49 million $SOL and $SOL equivalents. DeFi Development Corp. attributed the increase, worth more than $10 million, to continued purchases and organic treasury growth.
Forward Industries reported a much larger position on the same day, with approximately 8.16 million $SOL and $SOL equivalents held as of Sept. 21. Its holdings represented roughly 1.39% of Solana's circulating supply.
Between Aug. 4 and Sept. 20, Forward accumulated roughly 357,000 $SOL through purchases and staking rewards.
$SOL's latest rally has also coincided with liquidations among leveraged traders positioned for a decline.
CoinMarketCap's market analysis recorded more than $21 million in $SOL short liquidations over 24 hours as the token broke above recent resistance.
Short liquidations require traders to buy back positions, creating market purchases as prices rise.
$SOL reached roughly $119 on Sept. 21, its highest territory since January, after gaining more than 9% over 24 hours at one stage.
Bitcoin's recovery towards $86,000 during the same period coincided with gains across several large cap cryptocurrencies.
Investors are also looking at developments within the Solana ecosystem, with ZetaChain holders voting on Sept. 20 to move the project from its Cosmos based Layer 1 to Solana.
Proposal 68 passed with 99.4% support and 58% participation, comfortably clearing the required 40% quorum.
The approval allows ZetaChain to begin preparations for winding down its existing blockchain and converting native $ZETA into an SPL token on Solana at a 1:1 ratio.
$ZETA's ticker and total supply will remain unchanged under the plan, while ZetaChain's Anuma AI application is expected to move to Solana.
Anuma has more than 300,000 users and has processed over 1 million requests across 35 AI models, according to figures cited by the project.
Although the migration has not happened yet, investors may be pricing in the prospect of $ZETA and Anuma bringing more users and activity to Solana once the move is completed.
$SOL price analysis
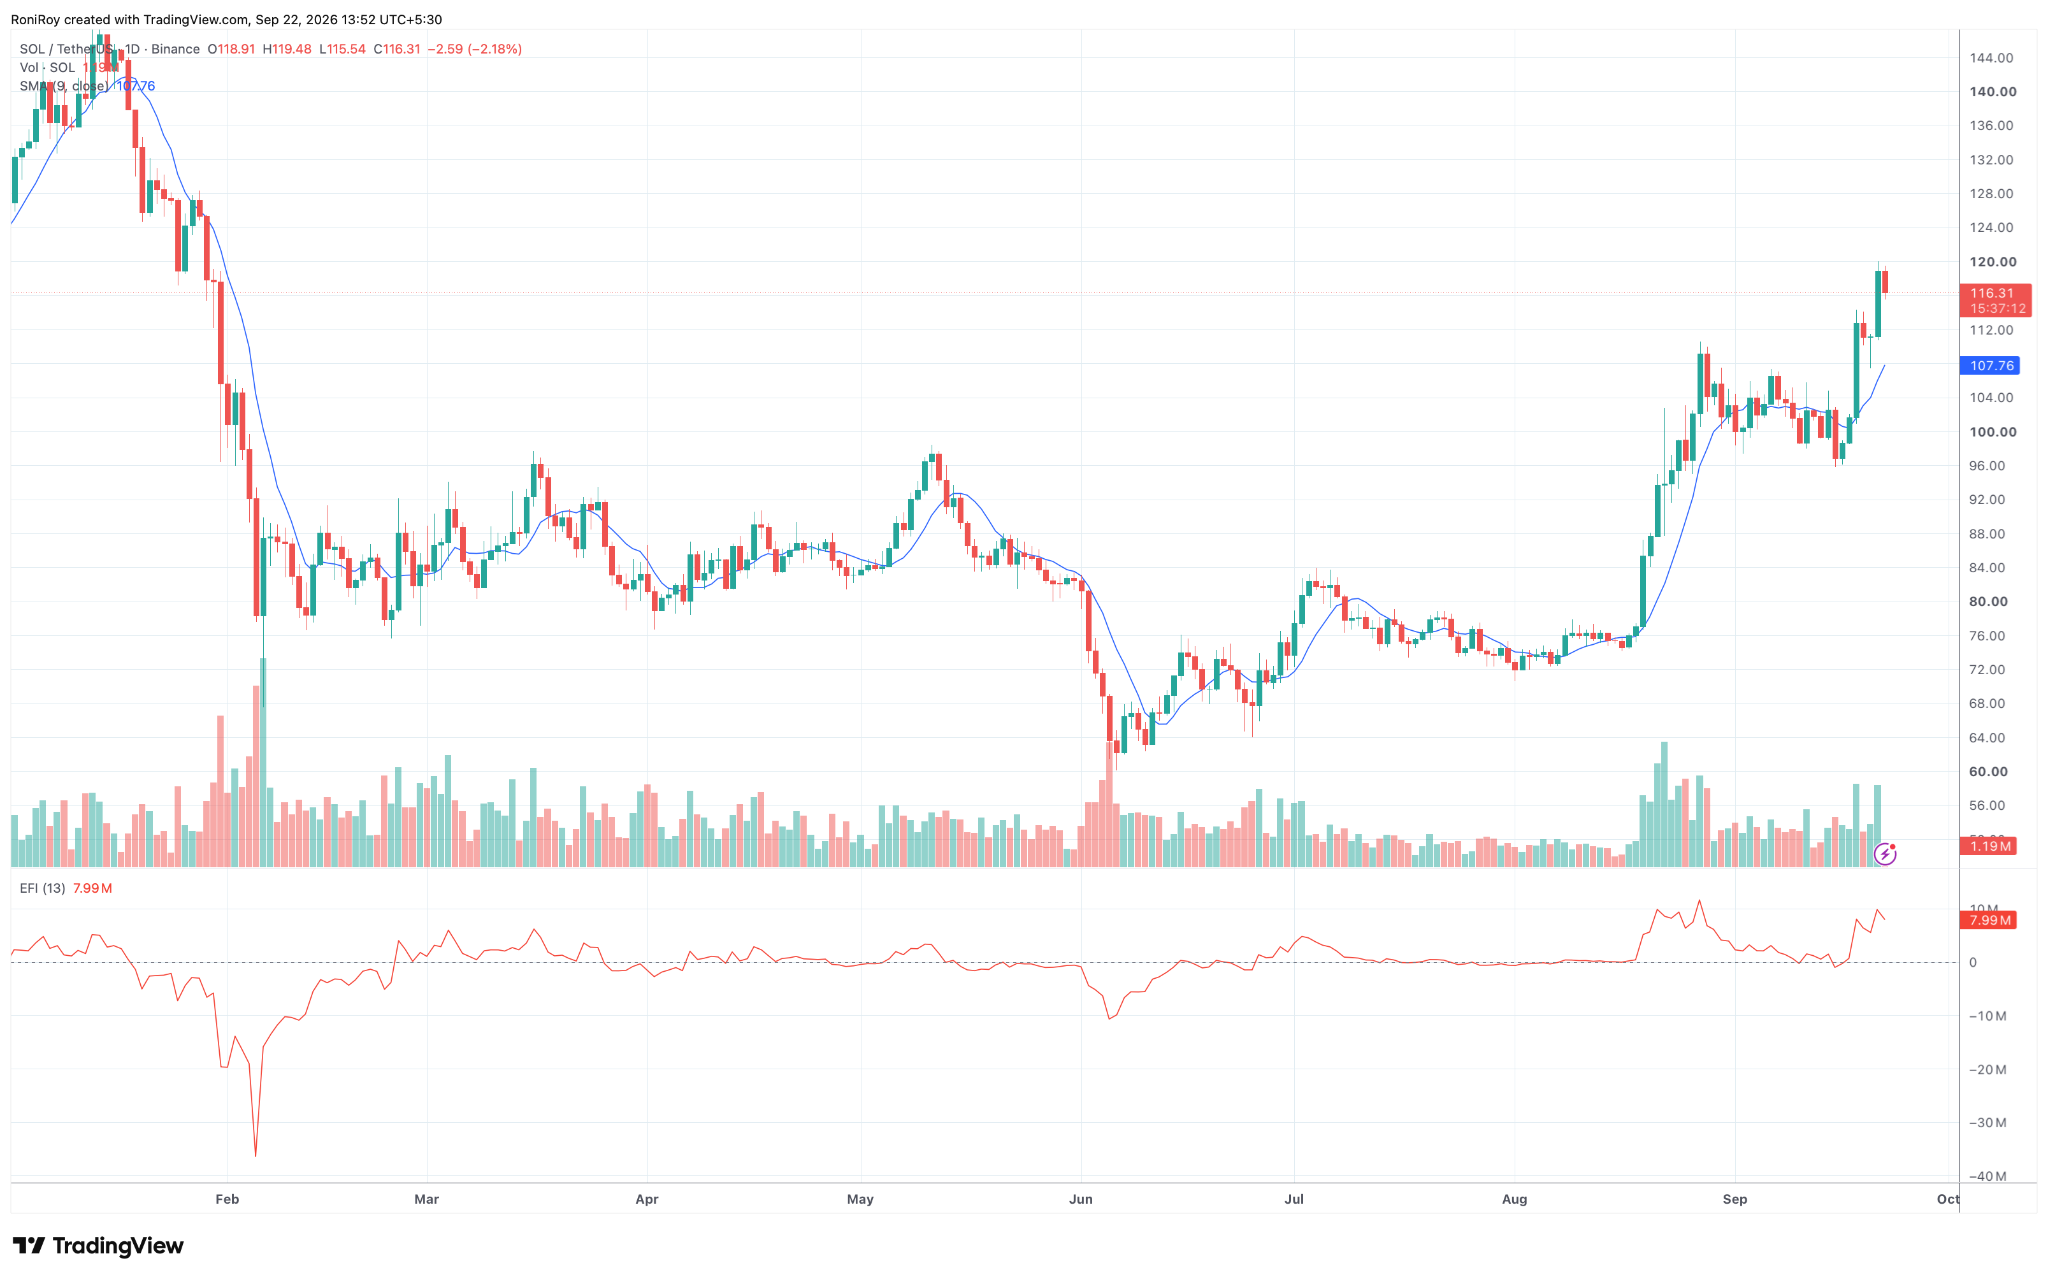
$SOL's daily price structure has strengthened significantly since its August breakout, with the token now trading near $116 after moving from below $80 in the second half of August.
The latest rally pushed $SOL to an intraday high near $119.48 before sellers appeared below $120.
The 9-day simple moving average has risen to roughly $107.76, leaving $SOL nearly 8% above its short-term trend line. See below.
$SOL/$USDT 1-day price chart. Source: TradingView.
A pullback that holds the $107 to $108 region would therefore keep price above the average that has tracked the latest leg of the rally.
Elder Force Index has climbed to approximately 7.99 million and remains well above zero.
The indicator combines price changes with volume, and its positive reading shows buying volume has dominated during $SOL's move towards $120.
EFI has returned towards levels seen during the late August breakout after easing during the consolidation around $100 earlier this month.
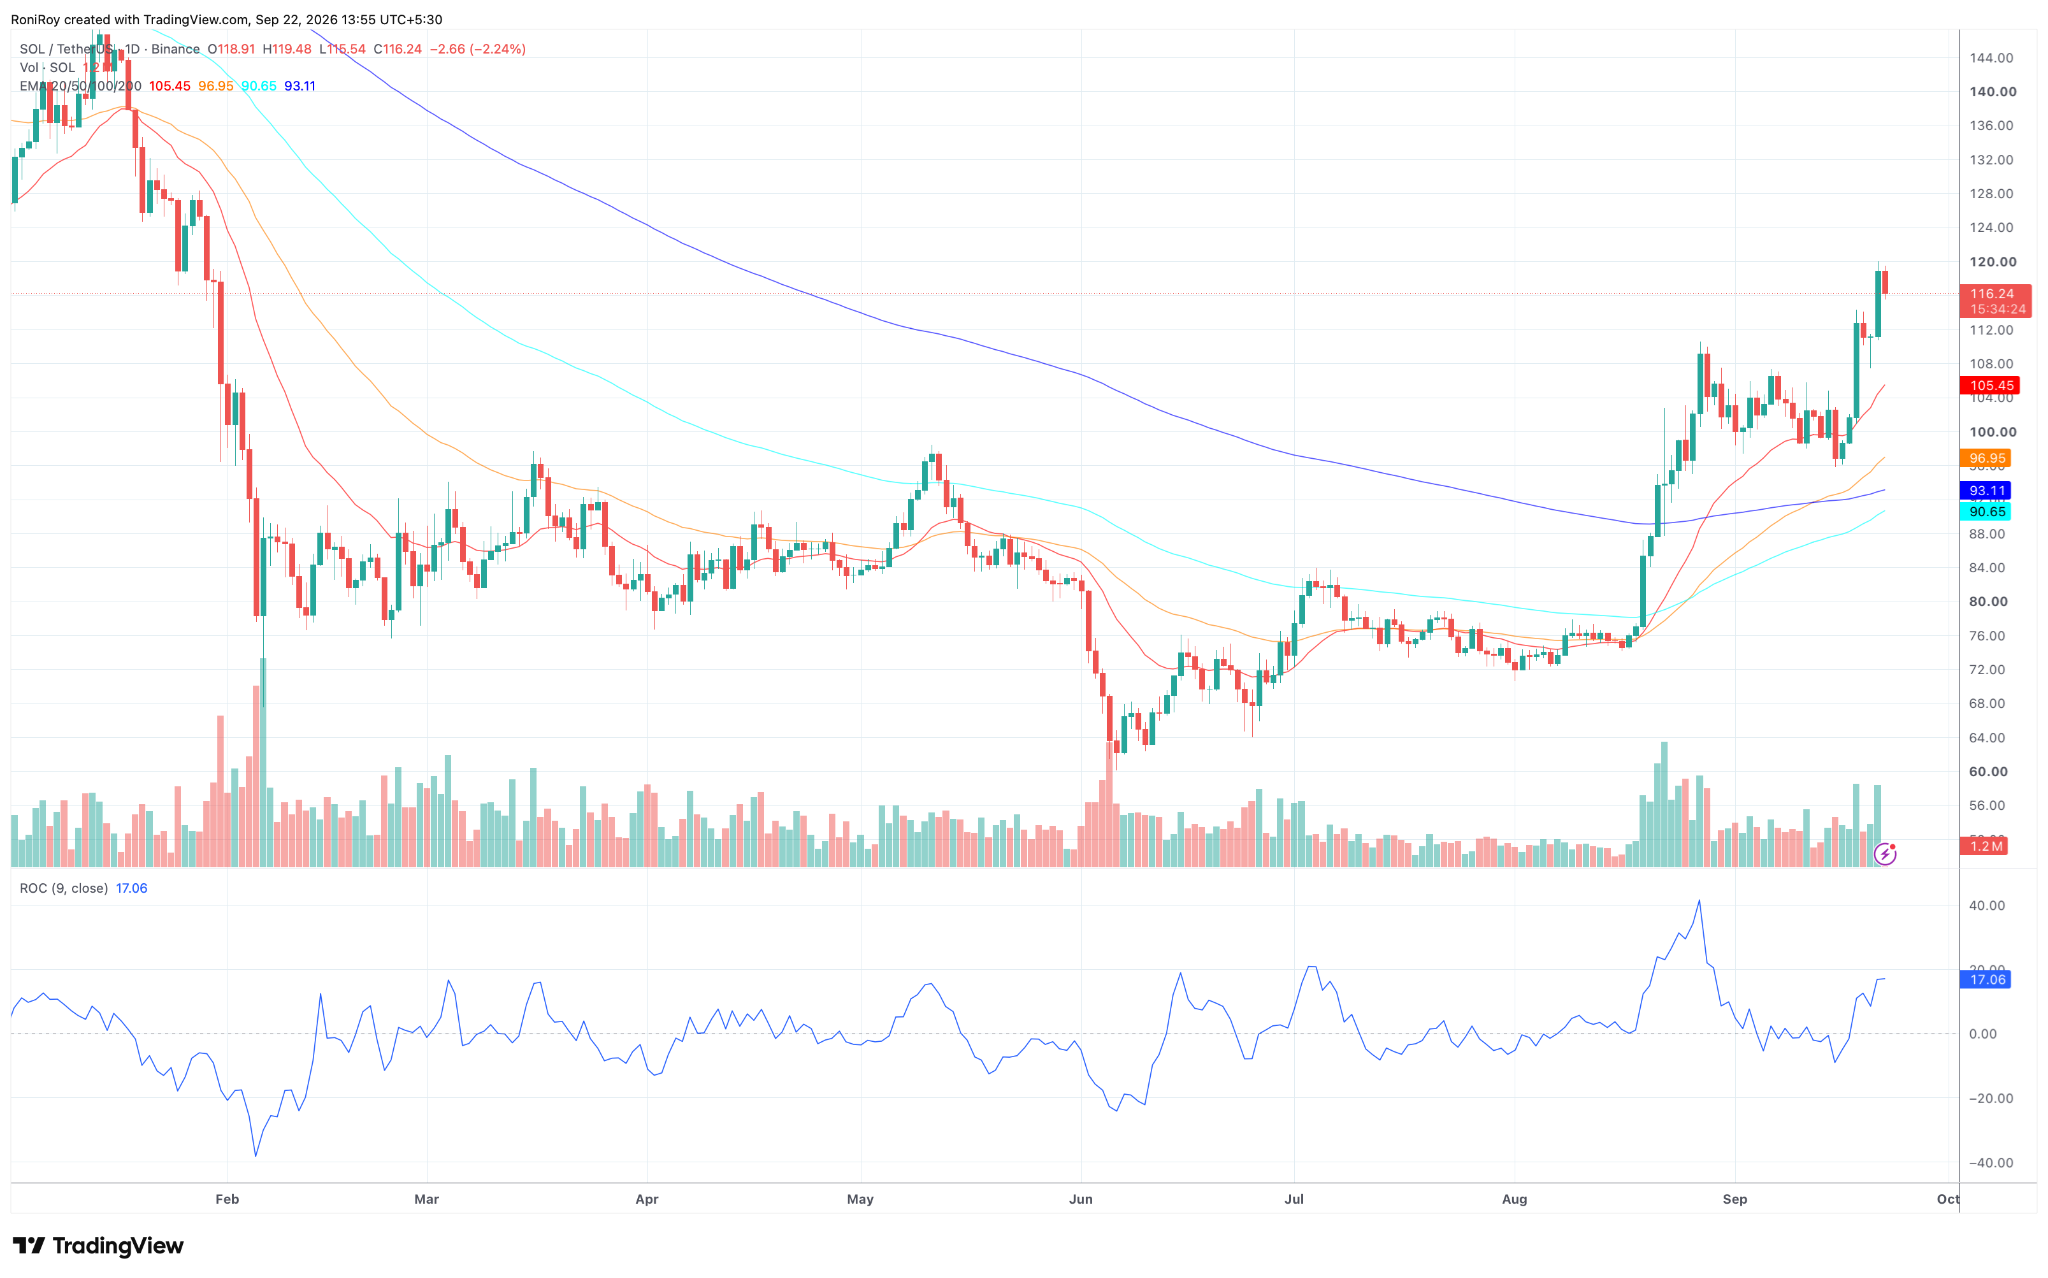
$SOL is trading comfortably above its key moving averages, with the 20-day EMA at $105.45, the 50-day EMA at $96.95, the 100-day EMA at $90.65 and the 200-day EMA at $93.11. See below.
$SOL/$USDT 1-day price chart. Source: TradingView.
Price moving above all four averages leaves $105 to $108 as the first support zone if $SOL retreats from $120.
A break below that area could expose the 50-day EMA near $97, which sits close to the $96 to $100 consolidation range formed earlier in September.
The 9-day Rate of Change stands at 17.06%, compared with readings near or below zero during $SOL's consolidation earlier this month.
ROC has accelerated alongside the latest price breakout, confirming that the speed of the rally has increased as $SOL approached $120.
A daily close above the $119 to $120 resistance area could open a move towards $124, followed by the $128 to $130 region visible around the January breakdown.
Failure to clear $120 would leave $107.76 and $105.45 as the closest technical supports, while a move below both would bring the $97 area back into focus.