
 thecryptobasic.com

$XRP Tests $1.41 Fibonacci Level as $1.45–$1.51 Resistance Zone Comes Into Focus.
$XRP is trading around $1.42 on the chart after advancing from the lower boundary of a descending parallel channel. Price has reached the 0.382 Fibonacci retracement at $1.4074, placing it directly around a key resistance area shown on the chart.
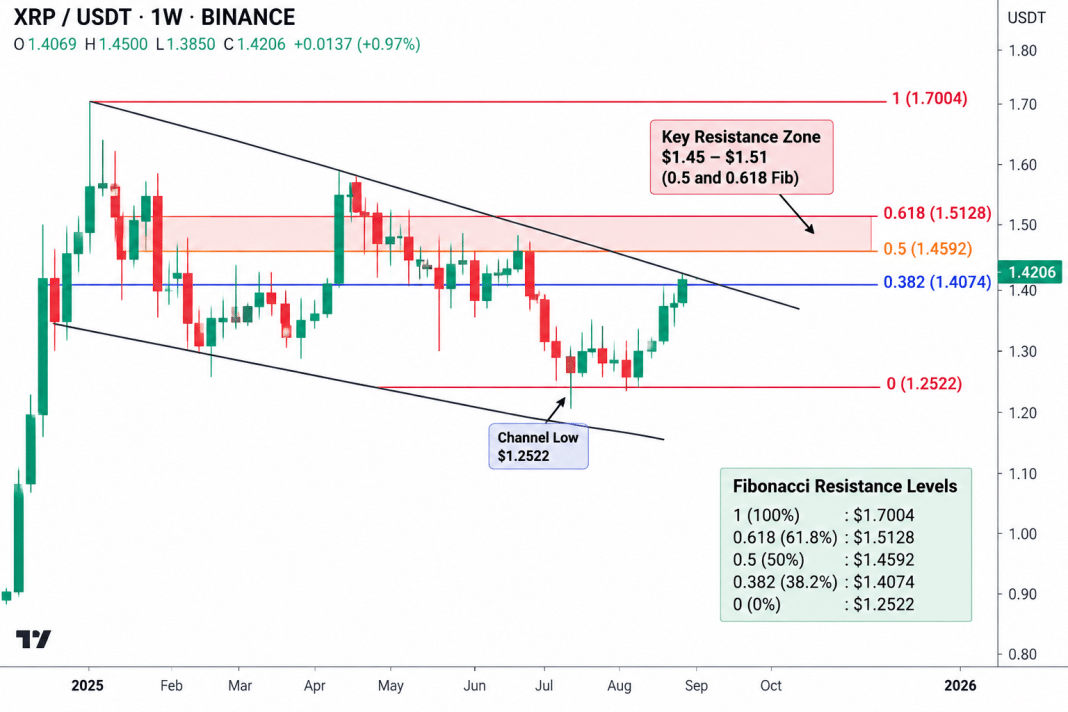
The Fibonacci structure is measured between $1.2522 and $1.7004. Above the 0.382 level, the next two retracement levels are $1.4592 at the 0.5 Fib and $1.5128 at the 0.618 Fib.
$XRP Faces Resistance Between $1.45 and $1.51
The chart therefore places $XRP’s next resistance pocket between approximately $1.459 and $1.513. The 50-week EMA is also reported near $1.51, putting it close to the 0.618 Fibonacci level.
$XRP has spent roughly five weeks consolidating after rebounding from the lower portion of the descending channel. The latest move lifted price from around $1.29–$1.30 to $1.42, bringing it back to the channel’s descending upper boundary.
The broader Fibonacci range identifies $1.7004 as the upper reference level. From the chart price of $1.4206, $XRP would need to rise approximately 2.7% to reach $1.4592, 6.5% to reach $1.5128, and 19.7% to revisit $1.7004.
On the downside, $1.4074 is the first displayed Fibonacci level below the current price, while $1.2522 marks the base of the measured Fibonacci range.
The chart therefore defines the immediate technical structure through four principal levels: $1.4074, $1.4592, $1.5128, and $1.7004.
To Reach $1.70
To reach $1.70, the chart shows two major resistance levels in between: $1.4592 (0.5 Fib) and $1.5128 (0.618 Fib). The $1.51 area is particularly significant because the 0.618 Fib coincides with the 50-week EMA cited in the setup.
A sustained move above $1.5128 would place $XRP above the highlighted $1.45–$1.51 resistance pocket. From there, the next major level displayed by the Fibonacci structure is $1.7004, approximately 19.7% above $1.4206.